Science Spotlight

Subscribe

Receive Science Institute news by email.

    All Science Spotlight Articles

    rss

    Map of area around Los Padres National Forest, showing where the bear tilapia
    This CDFW map shows the routes
    and distances traveled by both bears
    since being re-released in January.


    A light brown bear with a black muzzle sits on a green tarp in the bed of a navy blue pickup truck.
    The older bear, safely on her way
    back to the wilderness after being
    tranquilized in Montecito by a wildlife
    officer on April 2. (CDFW photo)

    We have an update on the two black bears that were burned in the Thomas Fire in late December/early January! Both bears were suffering from extensive burns to their paws when they were brought to CDFW’s Wildlife Investigations Lab in northern California. Under the care of CDFW Senior Wildlife Veterinarian Dr. Deana Clifford and Dr. Jamie Peyton of the UC Davis Veterinary Medical Teaching Hospital, the bears were given an unusual experimental treatment involving the use of sterilized tilapia skins as bandages. After the bears were well enough to survive on their own, they were returned to the Los Padres National Forest, as near as possible to where they were originally found. Both have covered many miles and each has been spotted at least once since their release.

    The younger bear was seen in an avocado orchard on May 29 by a biological consultant conducting a bird nesting survey. The bear ran away, which is a good sign that she has not become habituated. The consultant was able to get photos and video of the bear, who appears to be in good physical shape.

    The older bear, who was pregnant during treatment and at the time of her release in January, came down from the hills and wandered into the town of Montecito on April 2. A local wildlife officer tranquilized her and returned her to suitable habitat, and she’s stayed away from people ever since. Though she was reportedly in good general health, there has been no sign of a cub, so the pregnancy may not have been carried to term or the cub may not have survived.

    GPS collars on the bears allow CDFW biologists to track the animals’ movements so they can see where each one has been. Data shows the younger bear usually stays near Fillmore, but has made the 10-mile trek back to her release site in the Sespe Wilderness Area at least three times. She also made a brief trip over to Highway 5, north of Castaic. The older bear spends most of her time in the hills above Ojai. “We are encouraged and so pleased that both bears have survived for eight months now after burn treatment and release – they have walked hundreds of miles on their treated feet by now,” Dr. Clifford said.

    CDFW will continue to monitor the movements of both bears via their satellite collars for at least another year. The data will ultimately help scientists build their knowledge of how animals utilize landscapes affected by large fires.

    Read the original story of the Tilapia Bears at: https://tinyurl.com/y849mru7

    Top photo: The younger of the two bears, as seen in an avocado orchard on May 29. (Photo by Jessica West)

    Categories:   General

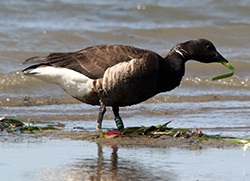
    A black brant, similar to a dark-colored goose, feeds on eelgrass in a sandy bay shoreline.
    Banded black brant feeding on eelgrass
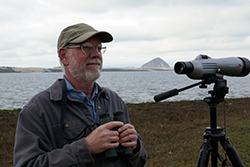
    A man with a gray beard and glasses, wearing a baseball cap and dark gray jacket, stands next to a spotting scope on a tripod, near Morro Bay, with Morro Rock in the background.
    Volunteer John Roser in the field at Morro Bay
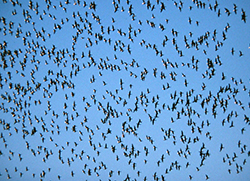
    Hundreds of dark-colored birds fly together in a bright blue sky
    Flock of black brant in flight above Morro Bay
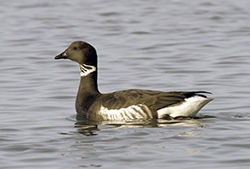
    A goose-like seabird with a black beak, dark hood, neck and coat, and white underside floats on bay water
    Black brant in Morro Bay

    John Roser began hearing the stories shortly after he moved to Los Osos, San Luis Obispo County, on the shores of Morro Bay in the mid-1990s.

    Longtime birders, waterfowl hunters, biologists and other coastal residents were all saying the same thing: It seemed fewer black brant were showing up on the bay each winter.

    The coastal sea goose is a cultural icon of the area, the signature species of the Morro Bay Winter Bird Festival and a temporary visitor welcomed by locals as the geese arrive each fall from their summer breeding grounds in the Arctic. When the geese are present in big numbers, you can hear their cacophony almost anywhere on the bay from November through April or until the warm environs of Baja California lure the birds farther south on their migration.

    Roser, who holds a degree in biology from Cal Poly San Luis Obispo and spent 25 years as an environmental educator, set out to see if the old-timers’ stories were true. For the past 21 years, he has provided CDFW and brant biologists throughout the Pacific Flyway with their most credible and reliable source of data on wintering brant in Morro Bay.<

    “I’m retired, and I wanted to take on a volunteer project that would make a difference in this community,” Roser said of his motivation. “I wanted to create a Morro Bay specific data set significant enough that it would be valuable in brant studies and research across the Pacific Flyway.”

    Roser’s initial efforts in 1997 focused on reading and reporting bands on individual birds with the help of a high-powered telescope. He has recorded more than 4,000 bands, including one affixed by a Russian ornithologist to a bird in Siberia some 5,000 miles away from Morro Bay where Roser spotted it. In addition to counting individual birds, Roser developed a formula – in consultation with brant biologists – to calculate the number of “brant use days” in Morro Bay each winter.

    Roser’s retirement project has led him on a brant-like odyssey.

    He banded brant one summer in Alaska, worked in Humboldt Bay with leading brant researcher Jeff Black and his Humboldt State University graduate students, and traveled to Baja California to help biologists read bands on birds at the extreme end of their southern range. Much of Roser’s winter observations take place at CDFW’s Morro Bay Wildlife Area.

    “John is our go-to guy on the ground in Morro Bay for sure,” said Melanie Weaver, the head of CDFW’s Waterfowl Program. “We only have two employees in our program, myself included, so we depend on regional staff and volunteers like John to help compile survey data. John is part of the local community, he cares, and he is close to the resource.”

    The data Roser supplies are incorporated into CDFW’s Mid-winter Waterfowl Survey, which is used to set hunting regulations for the following waterfowl season.

    What attracts brant to Morro Bay is the same thing that prompts the birds to stop at other coastal bays along their southward migration: eelgrass. The underwater seagrass grows in shallow marine environments and is the birds’ primary food source.

    Roser’s initial research in 1997 confirmed the reports he was hearing: The wintering brant population in Morro Bay had declined significantly and corresponded with a crash in eelgrass acreage in the bay.

    While CDFW surveys from the 1930s through 1960s documented Morro Bay’s wintering brant population as high as 11,800 birds, Roser’s first survey in 1997 recorded a population high of fewer than 700 birds.

    The eelgrass crash in the mid-1990s was temporary and well-understood, caused by an influx of sediment from a fire-ravaged landscape, a deluge of freshwater from a rainy year and warming El Nino ocean conditions. As environmental conditions normalized in subsequent years, the eelgrass rebounded, and the brant returned. Roser counted a population high of 4,600 birds in Morro Bay in 2001.

    The story since then, as told in Roser’s annual reports to CDFW, is of another dramatic crash in eelgrass acreage in Morro Bay and a corresponding drop in the numbers of brant wintering there. Unlike the eelgrass crash of the mid-1990s, the latest decline has been more persistent and perplexing.

    Biologists measure Morro Bay’s eelgrass acreage each year. Eelgrass spanned 344 acres as recently as 2007 but had dwindled to just 14 acres by 2017. Not surprisingly, Roser’s 2016-17 brant survey recorded a population high of just 319 birds and a low of 43. Roser’s brant-use-day metric has fallen by 90 percent since the nearly 500,000 brant use days he recorded in 2001. In the past five years, brant use days have measured around 50,000 a year. Money from the purchase of the California duck stamp-validation, required to hunt waterfowl in California, is funding research into the eelgrass decline along with restoration efforts.

    In addition to fewer numbers of brant frequenting Morro Bay, Roser has noticed behavioral changes in the birds that still show up. Increasingly, the brant are foraging on secondary food sources that include salt marsh vegetation and green algae species such as sea lettuce with eelgrass in short supply.

    Roser takes some solace that the overall Pacific Flyway brant population is holding steady if not increasing, estimated between 130,000 to 165,000 birds. Roser says waterfowl biologists are seeing flyway-wide changes in brant behavior that they suspect may be linked to climate change.

    Fewer brant are migrating to Mexico for the winter. More are remaining in Alaska and their northern range throughout the year as warming Arctic conditions require fewer calorie demands and less ice exposes more eelgrass. Ten years ago, less than 10 percent of the population wintered in Alaska. By 2017, almost 40 percent of the Pacific Flyway population spent the winter there.

    “This bird is tied to Morro Bay, our culture and our identity,” Roser said. “A robust wintering brant population needs abundant eelgrass beds. Eelgrass needs a healthy bay and watershed. Our actions as stewards of Morro Bay really do reverberate across the globe.”

    CDFW photos: courtesy of John Roser
    Top photo: Pair of black brant on Morro Bay

    Categories:   General

    CDFW Seasonal Aid Katie Schroyer determines the age of a dove by examining its wing

    light brown mourning dove held humanely in someone's hand
    A banded mourning dove at a CDFW trap site in northern California

    a woman's hand spreads a mourning dove's wing above a notebook
    Age and sex data are recorded before the bird is banded and released.

    a wire mesh bitd trap, approximately ten-by-seven-by-seven feet, in what looks like a barnyard
    A large kennel trap can catch more than 30 birds at a time.

    As the second half of California’s split dove season kicks off, dove hunters may put more than birds in their bags. They may harvest a bird with a band on its right leg – thus getting an opportunity to contribute important data that will help guide future management efforts.

    Since 2003, California has been an active partner in a nationwide assessment of mourning dove populations. California is one of 39 states that currently participate in dove banding. During the months of July and August, trained biologists and volunteers trap and band doves throughout the state. The banding of migratory birds requires a Master Banding Permit issued upon approval of a study application by the U.S. Geological Survey. All banders must pass an annual training to participate and are then issued a sub-permit.

    Mourning doves are so widely distributed that banding operations can be – and are – located almost anywhere, from rural locations to urban backyards. Larger operations located on Wildlife Areas, ranches and open desert sites may employ the use of a large kennel trap capable of trapping 30 or more birds at a time, while smaller operations (“backyard banders”) use small Kniffin traps that catch just one or two birds at a time.

    When a bird is banded, age and sex data are recorded. This information, along with capture location, date, bander name and corresponding band number, becomes part of a massive database managed by the USGS’s link opens in new tab or window Bird Banding Laboratory. The mourning dove banding data is available to any interested party, but is mainly used by the link opens in new tab or windowU.S. Fish and Wildlife Service (PDF), university scientists and state agency scientists to analyze and estimate annual survival, harvest rates, recruitment and abundance.

    The resulting analysis is used by wildlife managers in setting annual hunting regulations. For instance, in 2015, the USFWS increased the take of mourning doves in the Western Management Unit (which includes the states of California, Oregon, Washington, Idaho, Nevada, Utah and Arizona) from a daily bag limit of 10 to 15. The California Fish and Game Commission followed suit, also increasing the possession limit from two to three times the daily bag limit, in order to accommodate hunters on multi-day hunting trips.

    If you harvest or find (encounter) a banded bird, CDFW asks that you report the number directly to the Bird Banding Laboratory. This can be done online at link opens in new tab or windowwww.reportband.gov, or by calling (800)327-2263. When reporting an encounter you will be asked for the band number and basic information about where and how you obtained the band.

    The person reporting is allowed to keep the band, and will receive a certificate with the details about where, when and by whom the bird was banded.

    The USGS Bird Banding Lab is the keeper of banding data for both the US and Mexico. As of September 18, 2017 and since 1960, the BBL has received over 64 million banding records. Since the inception of the North American Bird Banding Program, the BBL has received over 4 million encounter records. On average, over the past decade, the BBL received 1.2 million banding and 87,000 encounter records per year.

    For more information about mourning dove banding, including the 2017 Mourning Dove Harvest Strategy, visit the link opens in new tab or windowDoves and Pigeons page on the FWS website.

    CDFW photos by Kloey Helms
    Featured photo: CDFW Seasonal Aid Katie Schroyer determines the age of a dove by examining its wing.

    Categories:   General

    Five deer wade knee-deep in blue lake water
    cute face of a mule deer

    Three people check and attach a collar to a doe
    doe on a hillside wears a research collar
    Mule deer buck in a dry meadow
    Two people collect deer pellets from a trail
    Doe and fawn look out from a dry-grassy ridge

    As California deer hunters head to the fields, forests and mountains this summer and fall, their experiences will provide wildlife biologists with key data on the health of the state’s deer herds. Wildlife biologists are already seeing the benefits of a 2015 regulation change requiring all deer tag holders to report how they did – successful or not – along with how many days they actually spent hunting, even if they never made it out at all. A record 84 percent of deer tag holders submitted harvest reports for 2016.

    “We’re getting more accurate and precise numbers for harvest than we’ve ever had before, which is critical for calculating the tag quota for the next year and conserving our deer populations for the future,” said Stuart Itoga, a senior environmental scientist with CDFW and the state’s deer program coordinator.

    Until recently, accurate deer harvest data had proved elusive. Prior to 2015, only successful California deer hunters had to report their take and only about 30 percent of those actually complied. CDFW supplemented the harvest data with numbers collected from game processing facilities, an inefficient process that still left an incomplete picture.

    “It’s Wildlife Management 101,” Itoga said. “You have to know what your population is, what’s coming in and what’s going out. We needed to have better numbers.”

    Following the mandatory reporting requirement in 2015, submittal rates for deer tag harvest reports jumped to 50 percent. In 2016, a $21.60 non-reporting penalty took effect, which applies to the purchase of future tags, and boosted reporting to the all-time high.

    Mandatory deer tag reporting data is just one of a number of new tools that has CDFW deer biologists excited about their ability to better assess California’s deer herds. An innovative DNA study of deer feces promises to give biologists new information about the size and characteristics of the state’s deer population.

    CDFW has also greatly expanded the use of deer tracking collars, thanks to improved technology. Since 2016, CDFW has affixed the relatively lightweight, remotely programmable, GPS tracking devices on 350 deer to learn more about their preferred habitat, in-state and out-of-state migration routes and sources of mortality other than hunting. Advanced camera technology also promises to improve the data collected from CDFW’s aerial and ground-based population surveys. A new computer model is being developed to incorporate all of these new data sources into more sophisticated, accurate and precise deer population estimates.

    “It’s really an exciting time to be doing this type of work,” Itoga said. “We’ve always used the best available science, but with technology moving at the pace it’s moving now, we have tools available to us now that we didn’t have even five years ago.”

    Management changes can happen more quickly as a result. For the upcoming 2017 deer hunting seasons, for example, deer tag quotas were cut in half in three highly desirable, Eastern Sierra X Zones – X9a, X9b and X12 – as a result of new data and field work that showed that migratory deer in these areas suffered from the long, intense winter.

    “Winter survival was poor,” Itoga said. “Our hope is that if we reduce the harvest this year, the populations will have a chance to rebound and increase next year.”

    Categories:   General

    sunrise over a California salt marsh
    two young women in a marsh, one holds a tiny mouse

    Deep in the pickleweed in the San Francisco, San Pablo and Suisun Bays, the tiny salt marsh harvest mouse (Reithrodontomys raviventris) tries to avoid predators and compete with other species for prime habitat. Food and cover are abundant, but its overall habitat is shrinking as humans encroach upon its home range. In south San Francisco Bay alone, 95 percent of the historic salt marsh has been lost to industrial parks and subdivisions. Annual flooding in the winter can be perilous, too -- when vegetation is topped by rising tides, the mice must scramble to find taller vegetation or into upland habitat (grasses around the wetlands that don’t get flooded by the tides).

    As part of the effort to monitor and conserve this state- and federally-listed endangered species, biologists conduct annual surveys of the salt marsh harvest mouse. The effort involves setting up traps stuffed with cotton batting and baited with birdseed and walnuts, taking measurements and collecting other data on the subjects that are captured. In some studies, the mice are fitted with GPS collars for tracking, or ear tags to help identify them upon recapture. In other studies, the biologists simply clip away fur on the mouse’s flank or neck – another method that helps them determine whether a mouse in a trap has crossed paths with them before.

    Once a mouse’s measurements have been recorded, they are set loose to scamper back into the pickleweed. The data that’s been collected will later be entered into a larger database that will be accessible to researchers from multiple state agencies (CDFW, the Department of Water Resources), federal agencies (US Fish and Wildlife Service, the US Geological Survey), educational research institutions (UC Davis, CSU San Marcos, San Francisco State) and private industry.

    By comparing population fluctuations and other data throughout the range, scientists hope to identify threats and increase their understanding of this rare rodent’s biology and behavior – ultimately helping to better inform future decisions on habitat management, restoration and enhancement efforts.

    Categories:   Wildlife Research