Science Spotlight

Subscribe

Receive Science Institute news by email.

    All Science Spotlight Articles

    rss

    The California Department of Fish and Wildlife (CDFW) has completed its 2018 waterfowl breeding population survey -- and it’s good news for hunters and birdwatchers alike, as the total waterfowl population in the state now tops out at over a half million, for the first time in six years.

    Melanie Weaver, who oversees CDFW’s Waterfowl Program, said that duck populations responded positively to the wet winter conditions of 2017. “Given the good upland and wetland habitat conditions last year from excessive precipitation, we anticipated good production,” she said. “We are pleased to see that higher recruitment reflected in this year’s breeding population survey.”

    The full Breeding Population Survey Report, which can be found on the CDFW website, indicates the 2018 breeding population of mallards increased from 198,392 in 2017 to 272,859 (an increase of 38 percent). Mallards are the most abundant waterfowl species in the state, followed by gadwall (102,637) and cinnamon teal (78,498).

    Other ducks that increased in number include northern shovelers, wood ducks, redhead and canvasback. Overall, the total number of ducks increased from 396,529 to 549,180 (an increase of 39 percent).

    A few duck species did decline, including American wigeon, northern pintail, lesser scaup, ring-necked duck, ruddy duck and common merganser. But Weaver gave two possible explanations for these dips. First, none of these species are considered “strong nesters” in California. They migrate through the state, but don’t breed here in high numbers. And second, the survey is designed for dabbling ducks, meaning that diving ducks (such as mergansers) are harder for biologists to detect.

    The survey also included Canada geese, which dropped slightly in number, from 55,224 in 2017 to 54,851 this year. (Canada geese are detected and recorded throughout the survey; however, the number reported refers to the traditional nesting population in northeastern California.)

    CDFW biologists and warden pilots have conducted this survey annually using fixed-wing aircraft since 1948. The population estimates are for those areas where the vast majority of waterfowl nesting occurs in California, including wetland and agricultural areas in northeastern California, throughout the Central Valley, the Suisun Marsh and some coastal valleys.

    In 2018, the survey was flown April 24-28 in the Central Valley and May 9-10 in northeastern California. A few planned survey segments were cancelled due to weather conditions (fog in the Napa-Santa Rosa area, and high winds in a few planned transects in the northeastern part of the state). However, the crew was able to cover 97 percent of the planned survey transects.

    The majority of California’s wintering duck population originates from breeding areas surveyed by the U.S. Fish and Wildlife Service (USFWS) in Alaska and Canada. Those survey results should be available in early August. CDFW survey information, along with similar data from other Pacific Flyway states, is used by the USFWS and the Pacific Flyway Council when setting hunting regulations for the Pacific Flyway states, including California.

    CDFW Photo

    ###

    Media Contacts:
    Melanie Weaver, CDFW Wildlife Branch, (916) 445-3717
    Kirsten Macintyre, CDFW Communications, (916) 322-8988
     

    Categories:   Wildlife Research

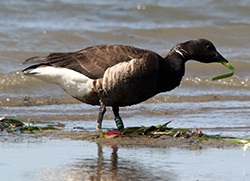
    A black brant, similar to a dark-colored goose, feeds on eelgrass in a sandy bay shoreline.
    Banded black brant feeding on eelgrass
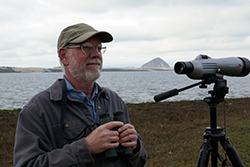
    A man with a gray beard and glasses, wearing a baseball cap and dark gray jacket, stands next to a spotting scope on a tripod, near Morro Bay, with Morro Rock in the background.
    Volunteer John Roser in the field at Morro Bay
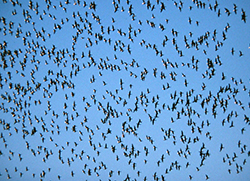
    Hundreds of dark-colored birds fly together in a bright blue sky
    Flock of black brant in flight above Morro Bay
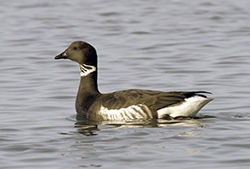
    A goose-like seabird with a black beak, dark hood, neck and coat, and white underside floats on bay water
    Black brant in Morro Bay

    John Roser began hearing the stories shortly after he moved to Los Osos, San Luis Obispo County, on the shores of Morro Bay in the mid-1990s.

    Longtime birders, waterfowl hunters, biologists and other coastal residents were all saying the same thing: It seemed fewer black brant were showing up on the bay each winter.

    The coastal sea goose is a cultural icon of the area, the signature species of the Morro Bay Winter Bird Festival and a temporary visitor welcomed by locals as the geese arrive each fall from their summer breeding grounds in the Arctic. When the geese are present in big numbers, you can hear their cacophony almost anywhere on the bay from November through April or until the warm environs of Baja California lure the birds farther south on their migration.

    Roser, who holds a degree in biology from Cal Poly San Luis Obispo and spent 25 years as an environmental educator, set out to see if the old-timers’ stories were true. For the past 21 years, he has provided CDFW and brant biologists throughout the Pacific Flyway with their most credible and reliable source of data on wintering brant in Morro Bay.<

    “I’m retired, and I wanted to take on a volunteer project that would make a difference in this community,” Roser said of his motivation. “I wanted to create a Morro Bay specific data set significant enough that it would be valuable in brant studies and research across the Pacific Flyway.”

    Roser’s initial efforts in 1997 focused on reading and reporting bands on individual birds with the help of a high-powered telescope. He has recorded more than 4,000 bands, including one affixed by a Russian ornithologist to a bird in Siberia some 5,000 miles away from Morro Bay where Roser spotted it. In addition to counting individual birds, Roser developed a formula – in consultation with brant biologists – to calculate the number of “brant use days” in Morro Bay each winter.

    Roser’s retirement project has led him on a brant-like odyssey.

    He banded brant one summer in Alaska, worked in Humboldt Bay with leading brant researcher Jeff Black and his Humboldt State University graduate students, and traveled to Baja California to help biologists read bands on birds at the extreme end of their southern range. Much of Roser’s winter observations take place at CDFW’s Morro Bay Wildlife Area.

    “John is our go-to guy on the ground in Morro Bay for sure,” said Melanie Weaver, the head of CDFW’s Waterfowl Program. “We only have two employees in our program, myself included, so we depend on regional staff and volunteers like John to help compile survey data. John is part of the local community, he cares, and he is close to the resource.”

    The data Roser supplies are incorporated into CDFW’s Mid-winter Waterfowl Survey, which is used to set hunting regulations for the following waterfowl season.

    What attracts brant to Morro Bay is the same thing that prompts the birds to stop at other coastal bays along their southward migration: eelgrass. The underwater seagrass grows in shallow marine environments and is the birds’ primary food source.

    Roser’s initial research in 1997 confirmed the reports he was hearing: The wintering brant population in Morro Bay had declined significantly and corresponded with a crash in eelgrass acreage in the bay.

    While CDFW surveys from the 1930s through 1960s documented Morro Bay’s wintering brant population as high as 11,800 birds, Roser’s first survey in 1997 recorded a population high of fewer than 700 birds.

    The eelgrass crash in the mid-1990s was temporary and well-understood, caused by an influx of sediment from a fire-ravaged landscape, a deluge of freshwater from a rainy year and warming El Nino ocean conditions. As environmental conditions normalized in subsequent years, the eelgrass rebounded, and the brant returned. Roser counted a population high of 4,600 birds in Morro Bay in 2001.

    The story since then, as told in Roser’s annual reports to CDFW, is of another dramatic crash in eelgrass acreage in Morro Bay and a corresponding drop in the numbers of brant wintering there. Unlike the eelgrass crash of the mid-1990s, the latest decline has been more persistent and perplexing.

    Biologists measure Morro Bay’s eelgrass acreage each year. Eelgrass spanned 344 acres as recently as 2007 but had dwindled to just 14 acres by 2017. Not surprisingly, Roser’s 2016-17 brant survey recorded a population high of just 319 birds and a low of 43. Roser’s brant-use-day metric has fallen by 90 percent since the nearly 500,000 brant use days he recorded in 2001. In the past five years, brant use days have measured around 50,000 a year. Money from the purchase of the California duck stamp-validation, required to hunt waterfowl in California, is funding research into the eelgrass decline along with restoration efforts.

    In addition to fewer numbers of brant frequenting Morro Bay, Roser has noticed behavioral changes in the birds that still show up. Increasingly, the brant are foraging on secondary food sources that include salt marsh vegetation and green algae species such as sea lettuce with eelgrass in short supply.

    Roser takes some solace that the overall Pacific Flyway brant population is holding steady if not increasing, estimated between 130,000 to 165,000 birds. Roser says waterfowl biologists are seeing flyway-wide changes in brant behavior that they suspect may be linked to climate change.

    Fewer brant are migrating to Mexico for the winter. More are remaining in Alaska and their northern range throughout the year as warming Arctic conditions require fewer calorie demands and less ice exposes more eelgrass. Ten years ago, less than 10 percent of the population wintered in Alaska. By 2017, almost 40 percent of the Pacific Flyway population spent the winter there.

    “This bird is tied to Morro Bay, our culture and our identity,” Roser said. “A robust wintering brant population needs abundant eelgrass beds. Eelgrass needs a healthy bay and watershed. Our actions as stewards of Morro Bay really do reverberate across the globe.”

    CDFW photos: courtesy of John Roser
    Top photo: Pair of black brant on Morro Bay

    Categories:   General

    brownish bull kelp lying on a tan beach
    aerial infrared photo of kelp forest off a small part of California coast

    Beneath the waters off the California coast are vast forests that are home to an astounding variety of animals. Their sunlit canopies can soar 150 feet from the ocean’s floor. But instead of trees, these forests are made of kelp.

    Worldwide, kelp is used in a host of everyday products like toothpaste, pudding, ice cream and even pharmaceuticals. Although kelp is valuable to humans, it is critical to sustaining life for many ocean-dwelling wildlife species ranging from microscopic plankton to sea otters, pelagic birds and predatory fishes. When a kelp forest is depleted, the entire underwater ecosystem can be thrown out of balance. This is why CDFW scientists are tracking and studying the amount of kelp growing in coastal waters.

    In 1989, CDFW marine biologists began using aerial surveys to monitor the size of the kelp forests off of California’s coast. A second survey was conducted a decade later, and since 2002, CDFW has made an effort to conduct these surveys annually (although budget issues sometimes require skipping a year).

    The surveys are conducted along the entire coastline and offshore of the Channel Islands. CDFW conducted the earliest surveys on its own, but now contracts out for this work. The contractor uses an aircraft with a specialized camera system that picks up the infrared image of the kelp. Those images become Geographic Information System (GIS) shapefiles that capture a snapshot of what the kelp canopy looks like on a given day. The images enable the viewer to see and compare the spatial area of a specific kelp forest over time.

    A graph depicting CDFW’s historic aerial kelp survey data is located on the Kelp and Other Marine Algae webpage.

    CDFW’s most recent (2016) kelp survey includes the following findings:

    • The south coast mainland and the Channel Islands both experienced a reduction in kelp when compared to 2015 levels. The south coast mainland had almost half the canopy level surveyed the previous year.
    • Along the central coast, kelp canopy levels were almost double that seen the previous year.
    • North central canopy levels, while still low, were just over five times the 2015 survey levels.
    • The north coast canopy levels were just over twice the 2015 measured canopy levels – but are still below the normal range for this area.

    Rebecca Flores Miller, a marine environmental scientist with CDFW’s Marine Region office in Monterey, was the coordinator for the 2016 kelp survey.

    “Kelp does fluctuate normally, anyway … there is a seasonality with it,” she explains. “However, during El Nino and warm water conditions as we’ve had in the recent past, the canopy doesn’t grow as well.”

    Coastal development can also negatively affect the kelp canopy, as it sometimes leads to pollution, increased turbidity (which reduces the light needed for photosynthesis) and siltation (which can hinder growth or bury young kelp). An increase in urchin populations can also have a dramatic impact on kelp, and recently, a wasting disease decreased the numbers of sea stars (a predator of urchins) statewide.

    “All of these things are connected within the ecosystem,” Flores Miller says.

    Kelp survey data is available to anyone who is interested – members of the general public, other governmental agencies, universities and researchers.

    The dataset has many uses, both within and outside of CDFW. It is used during the review process for commercial kelp bed lease requests. It has been a critical piece of the Marine Protected Area planning process. It has been used to help predict the abundance of many kelp forest-dependent species valued by humans, such as abalone. And it has helped scientists understand issues such as the recent abalone die-off in northern California.

    CDFW Photos: giant kelp and bull kelp (by Rebecca Flores Miller), and image of kelp forest near Cambria taken during the 2016 aerial kelp survey.

    Categories:   General

    Five deer wade knee-deep in blue lake water
    cute face of a mule deer

    Three people check and attach a collar to a doe
    doe on a hillside wears a research collar
    Mule deer buck in a dry meadow
    Two people collect deer pellets from a trail
    Doe and fawn look out from a dry-grassy ridge

    As California deer hunters head to the fields, forests and mountains this summer and fall, their experiences will provide wildlife biologists with key data on the health of the state’s deer herds. Wildlife biologists are already seeing the benefits of a 2015 regulation change requiring all deer tag holders to report how they did – successful or not – along with how many days they actually spent hunting, even if they never made it out at all. A record 84 percent of deer tag holders submitted harvest reports for 2016.

    “We’re getting more accurate and precise numbers for harvest than we’ve ever had before, which is critical for calculating the tag quota for the next year and conserving our deer populations for the future,” said Stuart Itoga, a senior environmental scientist with CDFW and the state’s deer program coordinator.

    Until recently, accurate deer harvest data had proved elusive. Prior to 2015, only successful California deer hunters had to report their take and only about 30 percent of those actually complied. CDFW supplemented the harvest data with numbers collected from game processing facilities, an inefficient process that still left an incomplete picture.

    “It’s Wildlife Management 101,” Itoga said. “You have to know what your population is, what’s coming in and what’s going out. We needed to have better numbers.”

    Following the mandatory reporting requirement in 2015, submittal rates for deer tag harvest reports jumped to 50 percent. In 2016, a $21.60 non-reporting penalty took effect, which applies to the purchase of future tags, and boosted reporting to the all-time high.

    Mandatory deer tag reporting data is just one of a number of new tools that has CDFW deer biologists excited about their ability to better assess California’s deer herds. An innovative DNA study of deer feces promises to give biologists new information about the size and characteristics of the state’s deer population.

    CDFW has also greatly expanded the use of deer tracking collars, thanks to improved technology. Since 2016, CDFW has affixed the relatively lightweight, remotely programmable, GPS tracking devices on 350 deer to learn more about their preferred habitat, in-state and out-of-state migration routes and sources of mortality other than hunting. Advanced camera technology also promises to improve the data collected from CDFW’s aerial and ground-based population surveys. A new computer model is being developed to incorporate all of these new data sources into more sophisticated, accurate and precise deer population estimates.

    “It’s really an exciting time to be doing this type of work,” Itoga said. “We’ve always used the best available science, but with technology moving at the pace it’s moving now, we have tools available to us now that we didn’t have even five years ago.”

    Management changes can happen more quickly as a result. For the upcoming 2017 deer hunting seasons, for example, deer tag quotas were cut in half in three highly desirable, Eastern Sierra X Zones – X9a, X9b and X12 – as a result of new data and field work that showed that migratory deer in these areas suffered from the long, intense winter.

    “Winter survival was poor,” Itoga said. “Our hope is that if we reduce the harvest this year, the populations will have a chance to rebound and increase next year.”

    Categories:   General

    duck with brown head and body, black back and beak, and red eyes
    grayish-brown duck with black and green wing feathers

    The California Department of Fish and Wildlife (CDFW) has completed its annual waterfowl breeding population survey.

    Mallards, gadwall and cinnamon teal comprised 54 percent of the ducks observed, down 30 percent from last year. The number of mallards decreased from 263,774 to 198,392 (a decrease of 25 percent) and total ducks decreased from 417,791 to 396,529 (a decrease of five percent).

    The most notable decrease occurred in the Sacramento Valley area, where mallards were estimated at a record low of 31,000 (73 percent below the long-term average).

    Given the abundant precipitation, one might expect the numbers to be higher. In some parts of the state, it did indeed increase available habitat (uplands and ponds). But in many areas, last winter’s heavy rains largely resulted in deep, fast-flowing water, which is not ideal for dabbling ducks. Other reasons for low duck observations could include winter flooding of nesting habitat that normally remains dry, the late-season flooding of the rice fields in the Sacramento Valley and the conversion of rice fields and pastures to tree crops.

    CDFW biologists and warden pilots have conducted this annual survey using fixed-wing aircraft since 1948. This year’s survey was conducted from April 3 through May 4 in the Central Valley, and May 9-10 in northeastern California. The population estimates are for the surveyed areas only, which include the majority of the suitable duck nesting habitat in the state. Surveyed areas include wetland and agricultural areas in northeastern California, throughout the Central Valley, the Suisun Marsh and some coastal valleys.

    The full Breeding Population Survey Report can be found at www.wildlife.ca.gov/conservation/birds/waterfowl.

    The majority of California’s wintering duck population originates from breeding areas surveyed by the U.S. Fish and Wildlife Service (USFWS) in Alaska and Canada. Those survey results should be available in early August. CDFW survey information, along with similar data from other Pacific Flyway states, is used by the USFWS and the Pacific Flyway Council when setting hunting regulations for the Pacific Flyway states, including California.

    Categories:   General