CNDDB News Blog

CNDDB logo

Subscribe

Sign up to receive new posts by email.

    Search

    rss
    • March 7, 2019

    The Spotted Owl Observations Database (SPOWDB) got a makeover! We have updated the SPOWDB’s symbology, i.e. how the data is shown on the map. Formerly, the mapped data showed positive observations (detections), negative observations (surveys with no detections), and activity centers. Now, in addition to positive and negative observations, you can see which points represent nests, young, and pairs. These changes took place automatically in the BIOS Viewer. If you would like to use the new symbology in ArcMap, be sure to use the Spotted Owl Observations layer files that come with the monthly download.

    diagram showing old and new symbology

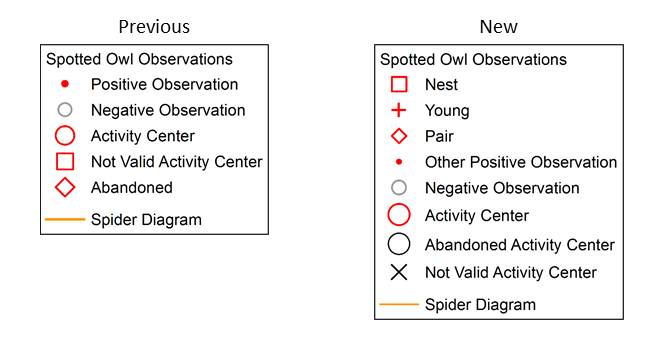
    There are also two new fields in the SPOWDB: Highest Use and Symbology. The Highest Use field reads the Nest, Young, Pair, and Number fields and reports the most significant value for each record. For example, if a pair was detected at a nest, the Highest Use field will read "Nest." If a non-nesting pair was detected, the Highest Use field will read "Pair." The Symbology field is populated with the activity center information in the TypeObs field: activity center, abandoned, and not valid. If these values are not present in the TypeObs field then the Highest Use value will be used to populate the Symbology field. Additional information on the new fields and their values can be found in the Spotted Owl Observations link opens in new windowmetadata.

    Be sure to open up the attribute table to see additional information for each record such as date, time, accuracy, and comments.

    Questions? Please contact the Spotted Owl Database Manager at owlobs@wildlife.ca.gov.

    Categories: General
    • July 31, 2018

    We have recently stopped including the point spatial data with our monthly GIS data package. The primary reason for this change is that the point data are often misinterpreted as representing actual element locations or observations. In fact, the point layer simply represents the centroids of the Element Occurrence (EO) polygons, and is intended to only be used when displaying CNDDB data on small-scale maps (i.e., maps that are zoomed out to show large areas). Furthermore, the polygons we create are not actually point observations, but instead reflect summary records for a given species (element) at a given location, and the size/shape of the polygons are based on the uncertainty of the location information associated with the records being summarized. This methodology has been employed by natural heritage programs for several decades, and the CNDDB bases our mapping standards on this Element Occurrence model in order to stay consistent with what other programs in the NatureServe network are doing (in other words, we want to make sure that an EO in California represents the same thing as an EO elsewhere).

    If anyone is interested in learning more, you can read about the Element Occurrence standard on NatureServe's Element Occurrence Data Standard web page. We have created a document that provides additional information, and includes instructions on how to generate a point shapefile using the CNDDB polygon layer if you have a need to do so: Creating Point Features from the CNDDB Spatial Data (PDF).

    Categories: General
    • July 31, 2018

    Misty Nelson photo

    Misty Nelson was recently hired as the Lead Scientist and supervisor of the CNDDB program. She brings nearly two decades of experience to the position, including a B.A. in Environmental Biology from the University of Montana, and an M.S. in Marine Science from the University of South Florida, where she studied the acoustic behavior of red grouper from marine reserves in the Gulf of Mexico.  She has worked in a wide range of natural resource science and data management positions, with projects spanning an array of taxa and subjects, including freshwater and marine fisheries, small mammal ecology, aquatic invasive weed surveys, large whale research, and noise and light pollution. Most recently, she worked with the CDFW Wildlife Branch, where she coordinated a large-scale terrestrial biodiversity monitoring effort at hundreds of locations in the Mojave Desert and Central Valley of California.

    Categories: General