In observance of GIS Day and the CNDDB’s 40th anniversary, let’s take a look back at the technological history of the CNDDB and how geographic information systems help us keep track of the thousands of rare species occurrences in this very diverse state!
The first true GIS, CGIS, was developed in 1960 by Roger Tomlinson to store and analyze the Canada Land Inventory’s extensive map collection. Other GIS systems were developed over the course of the 1960’s and 1970’s, leading to the release of commercially-available desktop software such as Esri’s ARC/INFO in the early 1980’s.
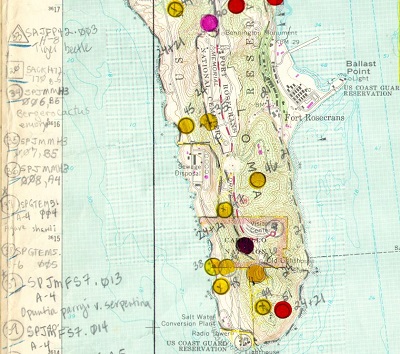
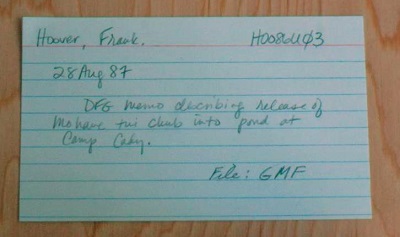
When the California Natural Diversity Database was founded in 1979, GIS was still a relatively new technology and wasn’t widely available. CNDDB staff documented locations of special status species by marking 7.5 minute topographic maps with stickers and writing notes in the map margins. They would fill out forms by hand, in pencil, documenting each element occurrence and index cards documenting each source. In this manner they created an extensive repository of over 15,000 occurrences!
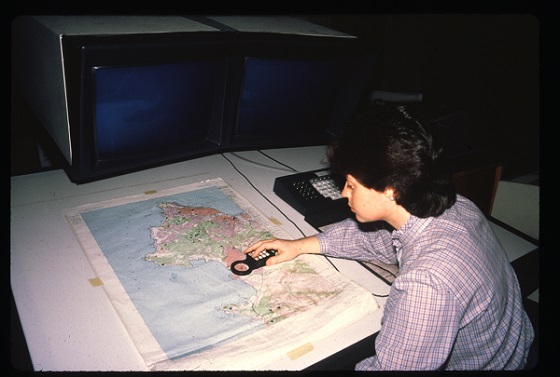
Over the course of the 1980’s and 1990’s, the CNDDB continued to adopt new GIS technologies as they became available. Occurrence locations were digitized into a CAD and occurrence forms were typed into a computer database. Later, the CNDDB adopted a true integrated GIS, and with advances in computer graphics technology they were able to display topographic overlays on their computer screens, mapping element occurrences fully on the computer and recycling the old library of paper maps.

The program distributed sensitive species information to our subscribers at first by printing out map overlays and occurrence reports in response to requests, but by the 1990’s had developed the RareFind software application to allow subscribers to view and display CNDDB data on their own computers.
Today, the CNDDB is the largest natural heritage program database of any state, with over 90,000 element occurrence records. GIS technology has played an integral role in helping the database to keep track of the vast amount of information available on the rare and sensitive species of California.
With the wealth of information accessible on the internet, the explosion of citizen science in recent years, and the increasing risk to sensitive species in a changing climate, it is an incredibly difficult task to keep the database up to date and summarize all observations of a given site into high-quality occurrence records. However, the CNDDB continues to evolve and adapt to new GIS technologies, and we eagerly look ahead to the future, just like the CNDDB staff who began this whole endeavor on pencil and paper, way back in 1979.