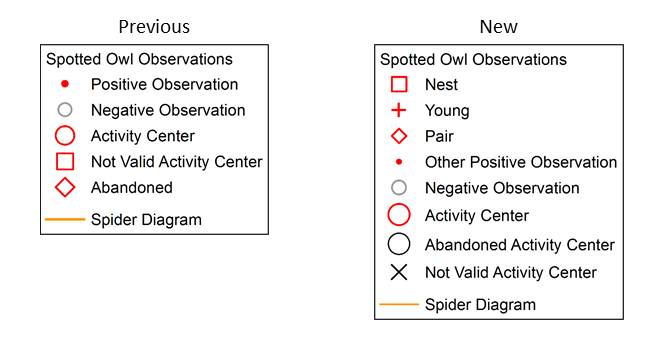
Description of the new symbology used for spotted owl observations.
The Spotted Owl Observations Database (SPOWDB) got a makeover! We have updated the SPOWDB’s symbology, i.e. how the data is shown on the map. Formerly, the mapped data showed positive observations (detections), negative observations (surveys with no detections), and activity centers. Now, in addition to positive and negative observations, you can see which points represent nests, young, and pairs. These changes took place automatically in the BIOS Viewer. If you would like to use the new symbology in ArcMap, be sure to use the Spotted Owl Observations layer files that come with the monthly download.

There are also two new fields in the SPOWDB: Highest Use and Symbology. The Highest Use field reads the Nest, Young, Pair, and Number fields and reports the most significant value for each record. For example, if a pair was detected at a nest, the Highest Use field will read "Nest." If a non-nesting pair was detected, the Highest Use field will read "Pair." The Symbology field is populated with the activity center information in the TypeObs field: activity center, abandoned, and not valid. If these values are not present in the TypeObs field then the Highest Use value will be used to populate the Symbology field. Additional information on the new fields and their values can be found in the Spotted Owl Observations  metadata.
Be sure to open up the attribute table to see additional information for each record such as date, time, accuracy, and comments.
Questions? Please contact the Spotted Owl Database Manager at owlobs@wildlife.ca.gov.