Science Spotlight

rss
  • February 16, 2018

A black brant, similar to a dark-colored goose, feeds on eelgrass in a sandy bay shoreline.
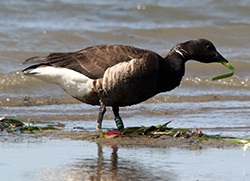
Banded black brant feeding on eelgrass

A man with a gray beard and glasses, wearing a baseball cap and dark gray jacket, stands next to a spotting scope on a tripod, near Morro Bay, with Morro Rock in the background.
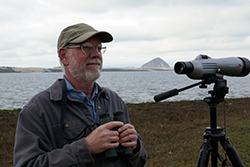
Volunteer John Roser in the field at Morro Bay

Hundreds of dark-colored birds fly together in a bright blue sky
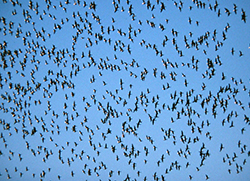
Flock of black brant in flight above Morro Bay

A goose-like seabird with a black beak, dark hood, neck and coat, and white underside floats on bay water
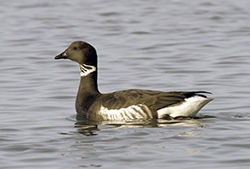
Black brant in Morro Bay

John Roser began hearing the stories shortly after he moved to Los Osos, San Luis Obispo County, on the shores of Morro Bay in the mid-1990s.

Longtime birders, waterfowl hunters, biologists and other coastal residents were all saying the same thing: It seemed fewer black brant were showing up on the bay each winter.

The coastal sea goose is a cultural icon of the area, the signature species of the Morro Bay Winter Bird Festival and a temporary visitor welcomed by locals as the geese arrive each fall from their summer breeding grounds in the Arctic. When the geese are present in big numbers, you can hear their cacophony almost anywhere on the bay from November through April or until the warm environs of Baja California lure the birds farther south on their migration.

Roser, who holds a degree in biology from Cal Poly San Luis Obispo and spent 25 years as an environmental educator, set out to see if the old-timers’ stories were true. For the past 21 years, he has provided CDFW and brant biologists throughout the Pacific Flyway with their most credible and reliable source of data on wintering brant in Morro Bay.<

“I’m retired, and I wanted to take on a volunteer project that would make a difference in this community,” Roser said of his motivation. “I wanted to create a Morro Bay specific data set significant enough that it would be valuable in brant studies and research across the Pacific Flyway.”

Roser’s initial efforts in 1997 focused on reading and reporting bands on individual birds with the help of a high-powered telescope. He has recorded more than 4,000 bands, including one affixed by a Russian ornithologist to a bird in Siberia some 5,000 miles away from Morro Bay where Roser spotted it. In addition to counting individual birds, Roser developed a formula – in consultation with brant biologists – to calculate the number of “brant use days” in Morro Bay each winter.

Roser’s retirement project has led him on a brant-like odyssey.

He banded brant one summer in Alaska, worked in Humboldt Bay with leading brant researcher Jeff Black and his Humboldt State University graduate students, and traveled to Baja California to help biologists read bands on birds at the extreme end of their southern range. Much of Roser’s winter observations take place at CDFW’s Morro Bay Wildlife Area.

“John is our go-to guy on the ground in Morro Bay for sure,” said Melanie Weaver, the head of CDFW’s Waterfowl Program. “We only have two employees in our program, myself included, so we depend on regional staff and volunteers like John to help compile survey data. John is part of the local community, he cares, and he is close to the resource.”

The data Roser supplies are incorporated into CDFW’s Mid-winter Waterfowl Survey, which is used to set hunting regulations for the following waterfowl season.

What attracts brant to Morro Bay is the same thing that prompts the birds to stop at other coastal bays along their southward migration: eelgrass. The underwater seagrass grows in shallow marine environments and is the birds’ primary food source.

Roser’s initial research in 1997 confirmed the reports he was hearing: The wintering brant population in Morro Bay had declined significantly and corresponded with a crash in eelgrass acreage in the bay.

While CDFW surveys from the 1930s through 1960s documented Morro Bay’s wintering brant population as high as 11,800 birds, Roser’s first survey in 1997 recorded a population high of fewer than 700 birds.

The eelgrass crash in the mid-1990s was temporary and well-understood, caused by an influx of sediment from a fire-ravaged landscape, a deluge of freshwater from a rainy year and warming El Nino ocean conditions. As environmental conditions normalized in subsequent years, the eelgrass rebounded, and the brant returned. Roser counted a population high of 4,600 birds in Morro Bay in 2001.

The story since then, as told in Roser’s annual reports to CDFW, is of another dramatic crash in eelgrass acreage in Morro Bay and a corresponding drop in the numbers of brant wintering there. Unlike the eelgrass crash of the mid-1990s, the latest decline has been more persistent and perplexing.

Biologists measure Morro Bay’s eelgrass acreage each year. Eelgrass spanned 344 acres as recently as 2007 but had dwindled to just 14 acres by 2017. Not surprisingly, Roser’s 2016-17 brant survey recorded a population high of just 319 birds and a low of 43. Roser’s brant-use-day metric has fallen by 90 percent since the nearly 500,000 brant use days he recorded in 2001. In the past five years, brant use days have measured around 50,000 a year. Money from the purchase of the California duck stamp-validation, required to hunt waterfowl in California, is funding research into the eelgrass decline along with restoration efforts.

In addition to fewer numbers of brant frequenting Morro Bay, Roser has noticed behavioral changes in the birds that still show up. Increasingly, the brant are foraging on secondary food sources that include salt marsh vegetation and green algae species such as sea lettuce with eelgrass in short supply.

Roser takes some solace that the overall Pacific Flyway brant population is holding steady if not increasing, estimated between 130,000 to 165,000 birds. Roser says waterfowl biologists are seeing flyway-wide changes in brant behavior that they suspect may be linked to climate change.

Fewer brant are migrating to Mexico for the winter. More are remaining in Alaska and their northern range throughout the year as warming Arctic conditions require fewer calorie demands and less ice exposes more eelgrass. Ten years ago, less than 10 percent of the population wintered in Alaska. By 2017, almost 40 percent of the Pacific Flyway population spent the winter there.

“This bird is tied to Morro Bay, our culture and our identity,” Roser said. “A robust wintering brant population needs abundant eelgrass beds. Eelgrass needs a healthy bay and watershed. Our actions as stewards of Morro Bay really do reverberate across the globe.”

CDFW photos: courtesy of John Roser
Top photo: Pair of black brant on Morro Bay

Categories: General
  • January 26, 2018

For residents of Humboldt and Del Norte counties, the majestic Roosevelt elk is a common sight. Although Roosevelt numbers were dwindling in California by the 1920s, conservative management strategies and limited hunting opportunities have helped them to rebound. Today, researchers have identified more than 20 distinct groups of elk in these two counties, many of which consist of well over 50 animals.

This conservation success story doesn’t come without a downside, though. Elk require large amounts of food to survive, and they tend to graze where food is most plentiful – often in agricultural areas and residential neighborhoods, where they cause damage to crops, landscaping, fencing and other private property.

Partly in response to rising concerns about property damage caused by the Humboldt and Del Norte herds, CDFW scientists are working on a wide-ranging, long-term study of Roosevelt elk population size and growth, herd movements, habitat use, disease and causes of mortality. The project, which is a collaborative effort with researchers from Humboldt State University, will collect critical baseline information about the animals that will help CDFW develop more robust and efficient methods for monitoring the herds, set future hunt quotas, inform local agencies about elk management and manage depredation issues. CDFW initiated this project in 2016 and expects to continue data collection efforts through 2018.

Tracking and studying one of the largest mammals in California is a much more complex undertaking than one might think. Roosevelt elk herds are wide-ranging and tend to graze in areas that are not easily accessible. Traditionally, CDFW relied on aerial surveys to monitor population trends of big game species such as elk, but such surveys are only feasible in a small portion of northwestern California because visibility is limited by steep terrain and dense vegetation. Ground surveys have similar constraints and are further limited by the small amount of occupied habitat that can be easily accessed from roads.

Given these constraints, CDFW scientists are employing multiple survey methodologies for the current study. Different techniques will be used in different habitat types. For example, in hard-to-reach areas, trail camera footage will be compared to visual surveys and used to collect herd composition data and estimate population size. Estimates will also be derived from analyzing the DNA contained in elk droppings.

CDFW also monitors the movement of the Roosevelt elk via electronic collars. There are currently 20 collared elk in coastal Del Norte and northern Humboldt counties and researchers hope to extend this project into central Humboldt County this winter, with plans to collar as many as 30 additional elk. Captured animals are also marked with ear tags, which allow for individual identification.

These survey efforts, and similar efforts elsewhere in the North Coast Roosevelt Elk Management Unit (EMU), are outlined in California’s Draft Elk Conservation and Management Plan, which is available for public review and comment through Monday, January 29. The plan provides guidance and direction to help set priorities for elk management efforts statewide.

CDFW photo: Environmental Scientist Carrington Hilson monitors a Roosevelt elk during a survey of the population.

Categories: General
  • July 25, 2017

Five deer wade knee-deep in blue lake water
cute face of a mule deer

Three people check and attach a collar to a doe
doe on a hillside wears a research collar
Mule deer buck in a dry meadow
Two people collect deer pellets from a trail
Doe and fawn look out from a dry-grassy ridge

As California deer hunters head to the fields, forests and mountains this summer and fall, their experiences will provide wildlife biologists with key data on the health of the state’s deer herds. Wildlife biologists are already seeing the benefits of a 2015 regulation change requiring all deer tag holders to report how they did – successful or not – along with how many days they actually spent hunting, even if they never made it out at all. A record 84 percent of deer tag holders submitted harvest reports for 2016.

“We’re getting more accurate and precise numbers for harvest than we’ve ever had before, which is critical for calculating the tag quota for the next year and conserving our deer populations for the future,” said Stuart Itoga, a senior environmental scientist with CDFW and the state’s deer program coordinator.

Until recently, accurate deer harvest data had proved elusive. Prior to 2015, only successful California deer hunters had to report their take and only about 30 percent of those actually complied. CDFW supplemented the harvest data with numbers collected from game processing facilities, an inefficient process that still left an incomplete picture.

“It’s Wildlife Management 101,” Itoga said. “You have to know what your population is, what’s coming in and what’s going out. We needed to have better numbers.”

Following the mandatory reporting requirement in 2015, submittal rates for deer tag harvest reports jumped to 50 percent. In 2016, a $21.60 non-reporting penalty took effect, which applies to the purchase of future tags, and boosted reporting to the all-time high.

Mandatory deer tag reporting data is just one of a number of new tools that has CDFW deer biologists excited about their ability to better assess California’s deer herds. An innovative DNA study of deer feces promises to give biologists new information about the size and characteristics of the state’s deer population.

CDFW has also greatly expanded the use of deer tracking collars, thanks to improved technology. Since 2016, CDFW has affixed the relatively lightweight, remotely programmable, GPS tracking devices on 350 deer to learn more about their preferred habitat, in-state and out-of-state migration routes and sources of mortality other than hunting. Advanced camera technology also promises to improve the data collected from CDFW’s aerial and ground-based population surveys. A new computer model is being developed to incorporate all of these new data sources into more sophisticated, accurate and precise deer population estimates.

“It’s really an exciting time to be doing this type of work,” Itoga said. “We’ve always used the best available science, but with technology moving at the pace it’s moving now, we have tools available to us now that we didn’t have even five years ago.”

Management changes can happen more quickly as a result. For the upcoming 2017 deer hunting seasons, for example, deer tag quotas were cut in half in three highly desirable, Eastern Sierra X Zones – X9a, X9b and X12 – as a result of new data and field work that showed that migratory deer in these areas suffered from the long, intense winter.

“Winter survival was poor,” Itoga said. “Our hope is that if we reduce the harvest this year, the populations will have a chance to rebound and increase next year.”

Categories: General
  • July 18, 2017

duck with brown head and body, black back and beak, and red eyes
grayish-brown duck with black and green wing feathers

The California Department of Fish and Wildlife (CDFW) has completed its annual waterfowl breeding population survey.

Mallards, gadwall and cinnamon teal comprised 54 percent of the ducks observed, down 30 percent from last year. The number of mallards decreased from 263,774 to 198,392 (a decrease of 25 percent) and total ducks decreased from 417,791 to 396,529 (a decrease of five percent).

The most notable decrease occurred in the Sacramento Valley area, where mallards were estimated at a record low of 31,000 (73 percent below the long-term average).

Given the abundant precipitation, one might expect the numbers to be higher. In some parts of the state, it did indeed increase available habitat (uplands and ponds). But in many areas, last winter’s heavy rains largely resulted in deep, fast-flowing water, which is not ideal for dabbling ducks. Other reasons for low duck observations could include winter flooding of nesting habitat that normally remains dry, the late-season flooding of the rice fields in the Sacramento Valley and the conversion of rice fields and pastures to tree crops.

CDFW biologists and warden pilots have conducted this annual survey using fixed-wing aircraft since 1948. This year’s survey was conducted from April 3 through May 4 in the Central Valley, and May 9-10 in northeastern California. The population estimates are for the surveyed areas only, which include the majority of the suitable duck nesting habitat in the state. Surveyed areas include wetland and agricultural areas in northeastern California, throughout the Central Valley, the Suisun Marsh and some coastal valleys.

The full Breeding Population Survey Report can be found at www.wildlife.ca.gov/conservation/birds/waterfowl.

The majority of California’s wintering duck population originates from breeding areas surveyed by the U.S. Fish and Wildlife Service (USFWS) in Alaska and Canada. Those survey results should be available in early August. CDFW survey information, along with similar data from other Pacific Flyway states, is used by the USFWS and the Pacific Flyway Council when setting hunting regulations for the Pacific Flyway states, including California.

Categories: General
  • May 17, 2017

A fisher climbs a tree trunk at night

Scientists with the California Department of Fish and Wildlife (CDFW) and Oregon State University recently published the results of a population study on fishers (Pekania pennanti) in northern California and southern Oregon. Led by CDFW Wildlife Statistician Dr. Brett Furnas and three coauthors, CDFW Senior Environmental Scientist Richard Callas, CDFW Research Analyst Russ Landers and Dr. Sean Matthews of Oregon State University, the study produced the first-ever robust estimates of density and size of the fisher population in northern California.

“This is the first time we’ve come up with a solid number of fishers, which is a starting point for tracking and monitoring populations,” Furnas said. “One of the most important tools we have used so far to help this species is reintroductions, so now -- with a baseline established and ongoing surveys planned -- we’ll be able to see if the population is really rebounding over time.”

Fishers in northern California and southern Oregon represent the largest remaining population in the Pacific states. The species once ranged from the state of Washington southward through Oregon and California. Currently, fishers occupy only a small portion of their historical range in that region. In California, fishers are found in the northern areas of the state and a small, isolated population occurs in the southern Sierra Nevada Mountains.

CDFW and the U.S. Fish and Wildlife Service have been petitioned on several occasions to list fishers as threatened or endangered under their respective Endangered Species Acts.

In 2016, while considering fishers in the southern Sierra Nevada Mountains of California, the California Fish and Game Commission voted that the petitioned action was warranted in part, choosing to accept the petition in the context of the Southern Sierra Nevada Evolutionarily Significant Unit, and adopted findings to that effect, which were published on May 6, 2016. Although fishers are relatively well-distributed in northern California and in portions of southern Oregon, data from existing surveys and prior studies was used to estimate abundance. This information is critically important to assess the status of fishers and serve as a baseline for conservation efforts.

Furnas and his coauthors used data from camera traps, hierarchical modeling of detections and non-detections of fishers from the cameras, and information about fisher home range size to develop their estimate of population size. They estimated that approximately 3,200 fishers occur within the northern California and southern Oregon study area, with an average density of 5.1 to 8.6 fishers per 100 square kilometers.

Estimating the sizes of wildlife populations is challenging, particularly for species such as the fisher that are difficult to observe and occur over large areas. A final population estimate for the fisher would not have been possible without the cooperation of a variety of federal and tribal agencies, universities and private landowners who shared datasets that were combined to complete the modeling. With these data, Furnas and his coauthors demonstrated that estimating the population size of the fisher at large geographic scales is feasible. They also suggested that the methods used in their research could be used to estimate the abundance of other carnivores, including black bear, gray fox and coyote.

The study was published in the journal Ecosphere. link opens in new windowMore information / view publication

Categories: Wildlife Research
CDFW Science Institute logo

Subscribe

Receive Science Institute news by email.