CNDDB News Blog

CNDDB logo

Subscribe

Sign up to receive new posts by email.

    Search

    rss
    • March 11, 2019

    Here's what's new since January:

    Number of Element Occurrences in Current Distribution: 92,390
    Number of Element Occurrences Added Since Last Distribution: 250
    Number of Source Documents Added: 1,950

    Species we’ve been working on:

    Botany

    • Anemone multifida var. multifida (cut-leaf anemone)
    • Ayenia compacta (California ayenia)
    • Brodiaea filifolia (thread-leaved brodiaea)
    • Centromadia parryi ssp. australis (southern tarplant)
    • Chloropyron maritimum ssp. maritimum (salt marsh bird's-beak)
    • Chorizanthe xanti var. leucotheca (white-bracted spineflower)
    • Cymopterus multinervatus (purple-nerve cymopterus)
    • Dodecahema leptoceras (slender-horned spineflower)
    • Eriastrum densifolium ssp. sanctorum (Santa Ana River woollystar)
    • Euphorbia ocellata ssp. rattanii (Stony Creek spurge)
    • Fremontodendron mexicanum (Mexican flannelbush)
    • Lessingia micradenia var. glabrata (smooth lessingia)
    • Lewisia cotyledon var. howellii (Howell's lewisia)
    • Penstemon sudans (Susanville beardtongue)
    • Streptanthus albidus ssp. peramoenus (most beautiful jewelflower)

    Zoology

    • Callophrys mossii bayensis (San Bruno elfin butterfly)
    • Callophrys mossii marinensis (Marin elfin butterfly)
    • Cottus klamathensis klamathensis (Upper Klamath marbled sculpin)
    • Cottus klamathensis polyporus (Lower Klamath marbled sculpin)
    • Rana boylii (foothill yellow-legged frog)
    • Spea hammondii (western spadefoot)

    We’ve also released an updated link opens in new windowSpecial Plants List – find out link opens in new windowwhat’s been added and download a new copy. We’ll be updating the animals next – stay tuned!

    Categories: Monthly Updates
    • March 7, 2019

    The Spotted Owl Observations Database (SPOWDB) got a makeover! We have updated the SPOWDB’s symbology, i.e. how the data is shown on the map. Formerly, the mapped data showed positive observations (detections), negative observations (surveys with no detections), and activity centers. Now, in addition to positive and negative observations, you can see which points represent nests, young, and pairs. These changes took place automatically in the BIOS Viewer. If you would like to use the new symbology in ArcMap, be sure to use the Spotted Owl Observations layer files that come with the monthly download.
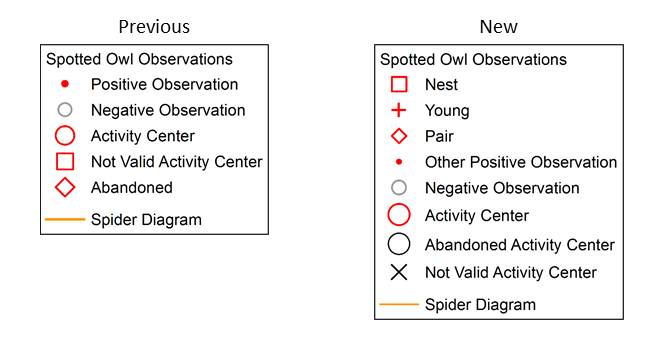
    diagram showing old and new symbology

    There are also two new fields in the SPOWDB: Highest Use and Symbology. The Highest Use field reads the Nest, Young, Pair, and Number fields and reports the most significant value for each record. For example, if a pair was detected at a nest, the Highest Use field will read "Nest." If a non-nesting pair was detected, the Highest Use field will read "Pair." The Symbology field is populated with the activity center information in the TypeObs field: activity center, abandoned, and not valid. If these values are not present in the TypeObs field then the Highest Use value will be used to populate the Symbology field. Additional information on the new fields and their values can be found in the Spotted Owl Observations link opens in new windowmetadata.

    Be sure to open up the attribute table to see additional information for each record such as date, time, accuracy, and comments.

    Questions? Please contact the Spotted Owl Database Manager at owlobs@wildlife.ca.gov.

    Categories: General
    • March 5, 2019

    As we hit the ground running for 2019, it’s nice to reflect back on the past year to see how far we’ve come. We’d like to share with all of you some of our proud accomplishments of 2018, as well as what we will strive to work towards in the coming year.

    2018 updates by county

    2018 accomplishments

    • 3,900 new occurrences mapped
    • 3,200 occurrences updated
    • 94,000 occurrences in CNDDB (Will we reach 100,000 in 2020?)
    • 230,000 total source records
      • 16,000 sources added (5,000 records added through the Online Field Survey Form)
      • 12,500 sources processed
      • From January 2018 through January 2019, botany reduced their data backlog by 20%

    Spotted Owl Observations Database:

    • 12,000 spotted owl records (7,000+ CSO and 5,000+ NSO) added
    • 1,500 spotted owl sites updated
    • 400 activity centers updated
    • 175,000 total spotted owl records
    • 1,000 barred owl records added to the Barred Owl Observations Database

    Other:

    • Provided 10 training classes for 114 students across the state
    • Reinvigorated our CNDDB iNaturalist Project (link opens in new windowJoin us!)
    • Continued work on the peregrine falcon, bald eagle, and golden eagle datasets in conjunction with the Wildlife Branch

    Our goals for the future

    • Improve communication with our users, starting with regularly updating this blog to keep people informed
    • Identifying ways to improve our efficiency and distribution of data to users
    • Exploring ways to better utilize data from citizen science sites such as iNaturalist, Calflora, and eBird

    We will continue to build a high-quality database for environmental planners and researchers to use for the purpose of protecting California’s rarest natural resources. That said, we can't do it without your help! Now is the perfect time to link opens in new windowsubmit your 2018 data. And as always, do not hesitate to contact us if you have any suggestions. Wishing everyone a wonderful 2019.

    Categories: Yearly review