Conservation Planning Data and Tools

Data and Tools for Landscape Conservation Planning

diagram indicating map layers

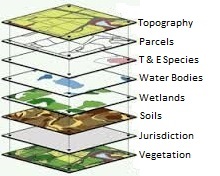
Landscape conservation plans and conservation priority maps or "greenprints" (PDF) demand the best available science and data on ecosystems, natural communities, and species. Of key importance is data in a spatially-explicit format, produced in Geographic Information Systems (GIS) as individual data layers that can be combined and communicated as maps for decision-making.

This page is intended as a guide to the correct use and availability of some of the major GIS data layers and decision support tools for large-scale conservation planning both within California and in the Western United States. Also included here are descriptions of non-spatial data sets for conservation planning.

Selecting Spatial (GIS) Data

Understanding the Intended Uses of a Spatial Data Layer

Users of a GIS data layer are advised to consult its accompanying metadata or “data about the data” file. The purpose for which a data layer was created, described in the metadata abstract, is the strongest indicator of its proper use. Authors of a data layer often include disclaimers both within the metadata and directly on any map products or fact sheets designed to accompany the data layer.
"What It Is / What it is Not" (PDF)
sheets may also be developed, one of the simplest ways to determine what an author intends to be a correct use of data.

Selecting Data Layers at the Right Spatial Scale

Ideally, GIS data layers used together in an analysis have a similar spatial scale. Scale may be defined in two ways. One is spatial extent -- how much area on the ground is represented by a data layer. The second is resolution – how coarse or fine is the delineation of landscape features. Resolution is often expressed as the minimum mapping unit the smallest unit mapped on the ground; features smaller than a minimum mapping unit will not be delineated.

Sample Vegetation and Land Cover Data Layers for the Point Reyes Peninsula at Two Different Scales of Resolution

These two data layers have the same spatial extent but different resolutions. The map on the left shows data with a minimum mapping unit of one acre and an average polygon size of 20 acres. The map on the right shows data with a minimum mapping unit of 250 acres and an average polygon size of 4,300 acres.

high resolution map example
Low resolution map example

Spatial (GIS) Data Layers for Conservation Planning

The table below some of the major GIS data layers for large-scale conservation planning both within California and in the Western United States. Most are available free for download.

Vegetation and Land Cover

Spatial Extent Description Title / Publisher Resolution
Selected Regions of the State California vegetation based on National Vegetation Classification System classification; vegetation polygons delineated from aerial photography and validated with field data; crosswalks to the equivalent habitat types of the California Wildlife Habitat Relationships (CWHR) System within the data sets also allow the user to identify vegetation types with high habitat suitability for wildlife using CWHR Vegetation Classification and Mapping Program (VegCAMP) California Department of Fish and Wildlife 1-2 acre minimum mapping unit
Statewide with State Divided Into Zones California vegetation types and forest structural characteristics based on remotely-sensed data and an automated, systematic procedure for identifying them; crosswalks to the equivalent habitat types of the California Wildlife Habitat Relationships (CWHR) System within the data sets allow the user to identify forested habitats with high suitability for wildlife using CWHR CALVEG USDA Forest Service Pacific Southwest Region 2.5 acre minimum mapping unit
Statewide Best available land cover data for California compiled into a single comprehensive data set; crosswalks to the equivalent habitat types of the California Wildlife Habitat Relationships (CWHR) System within the data sets allow the user to identify forested habitats with high suitability for wildlife using CWHR FVEG California Department of Forestry and Fire Protection Raster (pixelated) data; because the data set is a composite of several vegetation and land cover layers with different resolutions, size of polygons will vary when the data is converted to a polygon layer
Statewide by County with Counties Updated on a Rotating Schedule Surveys of agricultural land use and crop types based on aerial photography and satellite imagery; a crosswalk to the equivalent habitat types of the California Wildlife Habitat Relationships (CWHR) System (PDF)(opens in new tab) allows the user to identify agricultural habitats with high suitability for wildlife using CWHR Land Use Survey California Department of Water Resources Delineated boundaries of individual fields
Statewide Wetland and aquatic data; some data layers may overlap with sensitive habitats from ACE (below) California EcoAtlas Aquatic Resources Inventory San Francisco Estuary Institute, interagency California Wetland Monitoring Workgroup Variable

Ecologically Based Subdivisions of California

Spatial Extent Description Title / Publisher Resolution
Nationwide Ecological units classified and mapped based on biotic and environmental factors including climate, physiography, water, soils, air, hydrology, and potential natural communities Ecological Subregions: Sections and Subsections of the Conterminous United States United States Forest Service Variable
Nationwide Drainage basins represented as enclosed polygons in a nested hierarchy of sizes Watershed Boundary Data Set United States Geological Survey Variable

Biodiversity

Spatial Extent Description Title / Publisher Resolution
Western States Aggregated data for 16 states representing habitat for species of concern, native and unfragmented habitat, riparian and wetland habitat, terrestrial habitat connectivity, and quality habitat for species of importance Crucial Habitat Assessment Tools(CHAT) Initiative of the Western Governors’ Association Hexagons of 1 square mile or 3 square miles (depending on state) assembled across the states into a grid
Statewide Biodiversity “hotspot” assessment of species richness, rarity, and endemism and sensitive habitat occurrences; hotspots identified relative to the entire state Areas of Conservation Emphasis (ACE) – Statewide Layer California Department of Fish and Wildlife Hexagons of 2.5 square miles in a statewide grid
Regional Same as above but hotspots identified relative each of 19 USDA Ecoregional Subsections Areas of Conservation Emphasis (ACE) – Ecoregional Layers California Department of Fish and Wildlife Hexagons of 2.5 square miles in a statewide grid

Special Status or Sensitive Species

Spatial Extent Description Title / Publisher Resolution
Statewide Positive-sightings polygon data set of sensitive (threatened, endangered, rare, candidate, special concern, etc.) plant and animal occurrences. (Note: Does not include negative sightings = places where a species was surveyed but not found.) California Natural Diversity Database (CNDDB) California Department of Fish and Wildlife Variable
Nationwide Polygons delineating designated critical habitat for federally listed species Critical Habitat Maps United States Fish and Wildlife Service Variable

Terrestrial Habitat Connectivity

Spatial Extent Description Title / Publisher Resolution
Western United States Statewide assessments of habitat connectivity and wildlife corridors Initiative on Wildlife Corridors and Crucial Habitat Western Governors’ Association. See the Habitat Connectivity page for links to data sets from other western states. Resolution assumed to be similar as California statewide (see below); similar methods used in some cases
Statewide Statewide assessment of large, intact blocks of natural habitat and a “least-cost” modeling of connections between them ; based on remotely-sensed data of current ecological condition; independent of ownership, conservation status, or management California Essential Habitat Connectivity Project Prepared for California Department of Transportation, California Department of Fish and Wildlife, and Federal Highways Administration. 10,000 acre minimum mapping unit for habitat blocks connected by least cost modeling; 2,000 acre minimum mapping unit for habitat blocks not connected by modeling
Selected Regions of the State Regional assessments of large, intact blocks of habitats with corridors and linkages modeled between them See the Habitat Connectivity page for links to regional data sets published by SC Wildlands, University of California Davis, and California Department of Fish and Wildlife Variable

Aquatic Connectivity

Spatial Extent Description Title / Publisher Resolution
Statewide Anadromous fish passage priority barriers for removal; based on significance to fish migration; independent of who manages or is responsible for stream crossings Fish Passage Priorities California Department of Fish and Wildlife - See the
CalFish website
to navigate to “Habitat and Barriers” and then “Barriers”.
Priorities mapped as points

Existing Conservation Planning Efforts

Spatial Extent Description Title / Publisher Resolution
Statewide Boundaries of Natural Community Conservation Plans (NCCPs) and Habitat Conservation Plans (HCPs) either being planned or already permitted and being implemented Conservation Plan Boundaries, HCP and NCCP California Department of Fish and Wildlife Generally, regional multi-species plans; smallest is approximately 25,000 acres; localized, single species HCPs not included
Nationwide Non-spatial data related to HCPs Conservation Plans and Agreements Database United States Fish and Wildlife Service Non-spatial
Global, but subset available for United States Areas of biodiversity significance identified by TNC derived from
Ecoregional Assessments
as well as other planning methodologies
Ecoregional Portfolio The Nature Conservancy (TNC) Variable
Regional/Local May overlap with NCCPs/HCPs above, for counties and cities engaged in NCCPs or HCPs. City and County General Plans, especially Conservation and Open Space Elements. Some jurisdictions post GIS data layers online for download. (See example from
San Diego County
.)
Zones within a city or county

Existing Protected Lands

Spatial Extent Description Title / Publisher Resolution
Statewide Protected lands and the jurisdictions that own and manage them; individual jurisdictions may have additional information on their own holdings California Protected Areas Database (CPAD) GreenInfo Network Includes small urban parks of < 1 acre up to large wilderness areas >1,000,000 acres
San Diego County Comprehensive inventory of land conserved for the purpose of protecting open space and natural habitats Conserved Lands San Diego Association of Governments (SANDAG) Log in and choose “Ecology” as a GIS data category. Variable

All Terrestrial Vertebrates

Spatial Extent Description Title / Publisher Resolution
Statewide Polygons representing statewide range by season for more than 700 terrestrial vertebrates California Wildlife Habitat Relationships (CWHR) GIS Data California Department of Fish and Wildlife and California Interagency Wildlife Task Group Depends on species and how much is known about precise distribution within the range; polygons can range from thousands to millions of acres

Inland and Anadromous Fish

Spatial Extent Description Title / Publisher Resolution
Statewide Polygons representing statewide range for 119 fish inland and anadromous fish University of California, Davis and California Department of Fish and Wildlife See List of Public BIOS Data Layers and search for species common name. Variable; considered accurate to a scale of roughly 1:1,000,000

Non-spatial Data for Conservation Planning

Extent Description Title / Publisher
Nationwide Recovery plans for species federally-listed as threatened or endangered Recovery Plans United States Fish and Wildlife Service
Statewide Status, threats, and recovery actions for several state listed plant species California Threatened and Endangered Plant Profiles California Department of Fish and Wildlife
Statewide Status reports for wildlife species state-listed as threatened or endangered Status Reviews for State Listed Wildlife Species California Department of Fish and Wildlife Search https://nrm.dfg.ca.gov/documents/ContextDocs.aspx?cat=NonGameSpecies
Statewide Life history, distribution maps, status information and management recommendations for California Species of Special Concern Species of Special Concern Reports California Department of Fish and Wildlife
Statewide Life history accounts and range maps of all regularly occurring terrestrial vertebrates in California California Wildlife Habitat Relationships (CWHR) System Life History Accounts and Range Maps California Department of Fish and Wildlife and California Interagency Wildlife Task Group
Statewide Taxonomy, distribution and life history for special status invertebrates Special Status Invertebrate Species Accounts California Department of Fish and Wildlife
Statewide -- Aquatic Recovery strategies for selected fish species Species Conservation and Recovery [for Inland and Anadromous Fishes] California Department of Fish and Wildlife
Selected counties of the state Life history, modelled suitable habitat, occurrences, and status within the boundaries of an individual plan for all species covered by a plan Species accounts for regional conservation plans such as NCCPs or HCPs See plan summary pages, which have links to lead planning entity websites and resources such as species accounts.
Statewide – terrestrial, inland aquatic, and marine Modeled threats and stressors to targeted vegetation types, wetland and aquatic communities and native fish assemblages California State Wildlife Action Plan (2015) California Department of Fish and Wildlife
Selected counties of the state Conceptual models displaying drivers and threats to species or biological systems Models developed for regional conservation plans such as NCCPs or HCPs. Species-level models may be applicable across planning boundaries. See conceptual models developed for the San Diego Multiple Species Conservation Program NCCP/HCP and envirograms created for the Placer County Conservation Plan for examples.

Habitat Conservation Planning Branch
1010 Riverside Parkway, West Sacramento, CA 95605
Mailing: P.O. Box 944209, Sacramento, CA 94244-2090