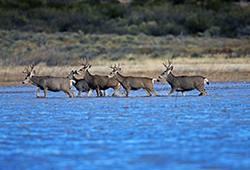
As California deer hunters head to the fields, forests and mountains this summer and fall, their experiences will provide wildlife biologists with key data on the health of the state’s deer herds.
Wildlife biologists are already seeing the benefits of a 2015 regulation change requiring all deer tag holders to report how they did – successful or not – along with how many days they actually spent hunting, even if they never made it out at all. A record 84 percent of deer tag holders submitted harvest reports for 2016.
“We’re getting more accurate and precise numbers for harvest than we’ve ever had before, which is critical for calculating the tag quota for the next year and conserving our deer populations for the future,” said Stuart Itoga, a senior environmental scientist with CDFW and the state’s deer program coordinator.
Until recently, accurate deer harvest data had proved elusive. Prior to 2015, only successful California deer hunters had to report their take and only about 30 percent of those actually complied. CDFW supplemented the harvest data with numbers collected from game processing facilities, an inefficient process that still left an incomplete picture.
“It’s Wildlife Management 101,” Itoga said. “You have to know what your population is, what’s coming in and what’s going out. We needed to have better numbers.”
Following the mandatory reporting requirement in 2015, submittal rates for deer tag harvest reports jumped to 50 percent. In 2016, a $21.60 non-reporting penalty took effect, which applies to the purchase of future tags, and boosted reporting to the all-time high.
Mandatory deer tag reporting data is just one of a number of new tools that has CDFW deer biologists excited about their ability to better assess California’s deer herds.
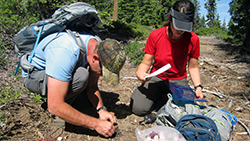
An innovative DNA study of deer feces promises to give biologists new information about the size and characteristics of the state’s deer population.
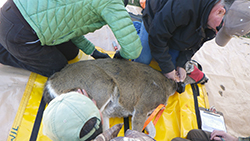
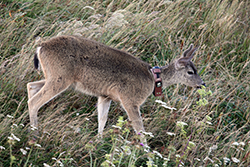
CDFW has also greatly expanded the use of deer tracking collars, thanks to improved technology. Since 2016, CDFW has affixed the relatively lightweight, remotely programmable, GPS tracking devices on 350 deer to learn more about their preferred habitat, in-state and out-of-state migration routes and sources of mortality other than hunting. Advanced camera technology also promises to improve the data collected from CDFW’s aerial and ground-based population surveys. A new computer model is being developed to incorporate all of these new data sources into more sophisticated, accurate and precise deer population estimates.
“It’s really an exciting time to be doing this type of work,” Itoga said. “We’ve always used the best available science, but with technology moving at the pace it’s moving now, we have tools available to us now that we didn’t have even five years ago.”
Management changes can happen more quickly as a result. For the upcoming 2017 deer hunting seasons, for example, deer tag quotas were cut in half in three highly desirable, Eastern Sierra X Zones – X9a, X9b and X12 – as a result of new data and field work that showed that migratory deer in these areas suffered from the long, intense winter.
“Winter survival was poor,” Itoga said. “Our hope is that if we reduce the harvest this year, the populations will have a chance to rebound and increase next year.”