ACE Viewer
Launch ACE Viewer
CDFW map viewers perform best in Google Chrome or Mozilla Firefox web browsers.
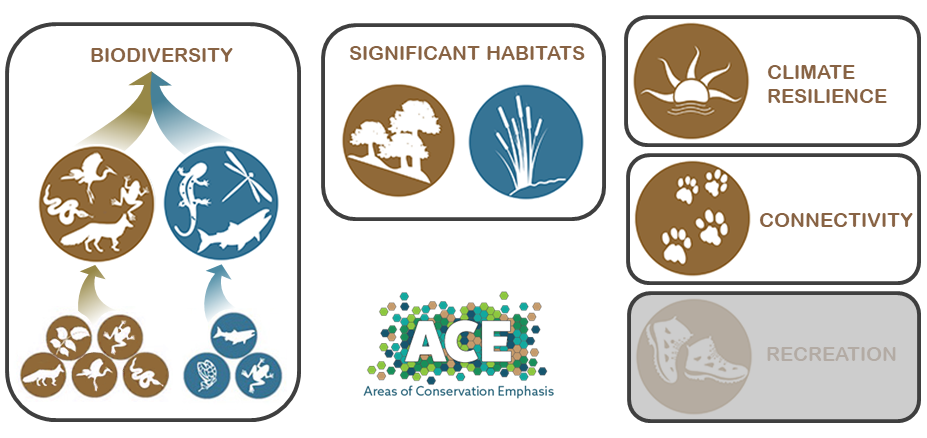
What is ACE?
Areas of Conservation Emphasis (ACE) is a CDFW effort to gather spatial data on wildlife, vegetation, and habitats from across the state, and then synthesize this information into thematic maps to help inform discussions on the conservation of biodiversity, habitat connectivity, and climate change resiliency. The ACE maps provide a coarse level view of information for conservation planning purposes. The ACE project draws from multiple sources of vetted species occurrence data, as well as predictive species modelling efforts. ACE data products however, do not replace the need for site-specific evaluation of biological resources and should not be used for regulatory purposes.
All ACE data layers are limited by the accuracy, scale, extent of coverage, and completeness of the input data at the time they were run. We highly recommend reviewing available metadata and ACE Factsheets (found in the folders below) prior to interpreting these data. The ACE data are dynamic and will be updated periodically as new data warrant. A new and improved version, ACE 3.0, was released in February 2018, and we welcome feedback on this latest version.