Age, Growth, and Maturity in Kelp Greenling
Background
The kelp greenling (Hexagrammos decagrammus) inhabits nearshore kelp beds and rocky reefs to a depth of 150 feet. Partly due to their proximity to shore, they are highly sought after by anglers, spear fishermen, and commercial fishermen. According to Recreational Fishery Information Network data, a total of 288,000 angler trips were expended by nearshore anglers targeting kelp greenling in 2008.
Despite their importance in the California recreational fishery, we have very little information regarding kelp greenling population dynamics. A 2006 greenling stock assessment was not accepted by management due to limited scientific data. Specifically, there was uncertainty regarding greenling age, growth, mortality rates and abundance estimates.
In 2007, CDFW initiated a study to more comprehensively determine age, growth, and maturity of kelp greenling by examining sectioned otoliths, small bones used to age fish, and gonads from a larger number of individuals over a wide size range and multiple locations.
Study Methods
Age and Growth
Kelp greenling were collected by spearfishing while diving and hook-and-line fishing from shore. Samples were collected from Carmel Bay and Fort Bragg. Fish total length, weight, sex, maturity state, gonad weight, and liver weight were recorded. Otoliths were removed and embedded in epoxy resin prior to sectioning. Sectioned otoliths were then mounted on glass slides and wet-sanded to enhance the resolution of growth zones. Otoliths develop these growth zones as the fish ages, much like growth rings visible in the cross section of a tree trunk. Polished otoliths were viewed under a dissecting microscope and the number of opaque bands (dark bands) counted to determine the fish's age.
Maturity and Reproduction
Digital photos were taken of testes and ovaries to document maturity and reproductive status. A maturity stage classification from 1 (immature) to 5 (resting) for male greenling and 1 (immature) to 4 (resting) for female greenling was determined for each fish.
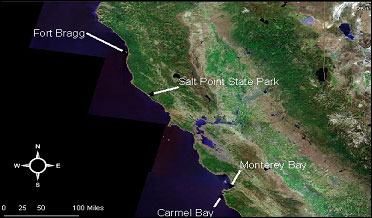 Sampling locations where kelp greenling were collected from December 2007 to February 2009.
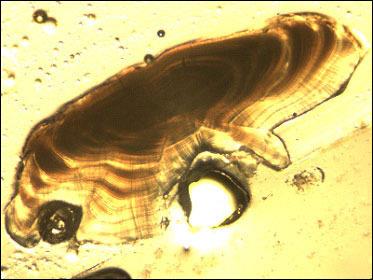 Sectioned kelp greenling otolith viewed under dissecting microscope.
Findings to Date
- Since August 2007, project staff and volunteers have collected a total of 357 kelp greenling through monthly sampling.
- 142 females from 126 - 411 mm total length (TL)
- 215 males from 116 - 391 mm TL
- An adequate number of male greenling over 20 cm TL have been collected. Therefore, divers are now concentrating effort on collecting females and smaller males (less than 20 cm TL).
- No significant difference in length was found between left and right otoliths.
- Project staff continue to mount, section, polish and read otoliths. Twenty otoliths have been sectioned and polished to date.
- Maturity data collected by project staff indicate that kelp greenling spawn from September to January.
- Age data analysis is currently underway. Stay tuned!
Age Validation of Cabezon and Kelp Greenling Using Oxytetracycline
Updated June 30, 2011
Background
Otoliths, often called "ear bones", are inner ear sensory organs used in hearing and balance. In fish, these bony structures have proven useful in determining ages and growth rates. Ages are estimated by counting pairs of growth bands formed in the otoliths, comprised of one opaque and one translucent band, similar to counting the rings in a tree trunk.
Many studies assume that growth bands are laid annually. The validation of these ages, or confirmation that each pair of growth bands represents one year of growth, is a step often overlooked or considered unachievable in ageing studies. However, validation is necessary to ensure that banding patterns accurately and consistently reflect growth over time, and that age estimates are correct. This is important because knowledge of age and growth is integral to understanding life history, a major component of essential fishery information (EFI) needed for sustainable management of our fisheries.
More EFI is needed for two nearshore fish species: the cabezon (Scorpaenichthys marmoratus) and the kelp greenling (Hexagrammos decagrammus). A 2006 stock assessment of kelp greenling was not accepted by management due to the lack of EFI regarding age, growth, mortality rates and abundance estimates. The CDFW is currently investigating the life history characteristics of kelp greenling, and age validation will be an important component of the study. Although information is available on cabezon age and growth, age validation is needed for this species as well.
Study Methods
In this study, we will attempt to validate the periodicity of growth band formation in cabezon and kelp greenling using a chemical marker. Live fish will be treated with oxytetracycline (OTC), an antibiotic which is readily incorporated into calcified tissues such as otoliths. The result will be a permanent mark in the otoliths at the time of tagging which is visible under fluorescent light. After one year, otoliths will be removed from marked fish and their growth bands read in relation to the fluorescent OTC band. A single pair of growth bands, formed after the addition of the OTC mark, will validate the method of ageing for each species.
Findings to Date
In April and July 2010, we collected 5 adult cabezon and 7 adult kelp greenling for age validation. Fish were held in tanks at Granite Canyon Marine Laboratories. Each fish was anesthetized then injected with a concentration of OTC based on the fish's weight. Although no cabezon lived past 11 months after treatment due to parasites or seawater issues, their otoliths are still useful in age validation. Kelp greenling that have survived for 1 year were ready for removal in July 2011. Otoliths will be removed and viewed for the OTC mark in the coming months. Stay tuned!
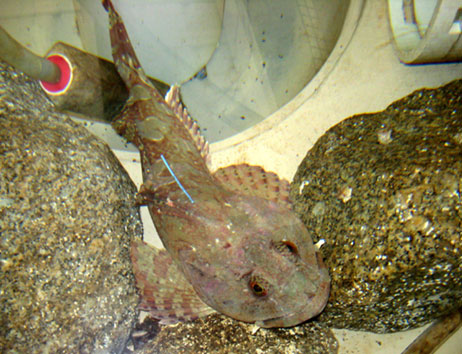 Cabezon that has been tagged and treated with OTC. Photo by Diane Haas.
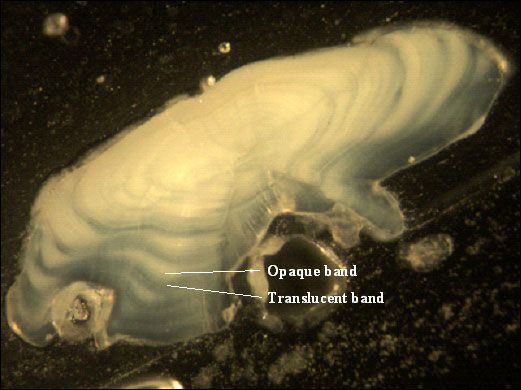 Sectioned kelp greenling otolith under reflected light (no OTC mark). Opaque and translucent growth bands are visible. CDFW photo by Diane Haas.
Nearshore Groundfish at Carmel Pinnacles State Marine Reserve
Background
In 1999, the California legislature passed the Marine Life Protection Act (MLPA) to help conserve biodiversity, protect habitat, and rebuild depleted fisheries. As part of the MLPA, in fall of 2007 a network of 29 marine protected areas (MPAs) was implemented along the central California coast between Pigeon Pt. and Pt. Conception. The MLPA calls for monitoring of selected areas to assist with adaptive management of the MPA network (see MLPA Master Plan).
Many of the central coast MPAs are currently being monitored or have been studied in the past; however, few data exist for the Carmel Pinnacles State Marine Reserve (Pinnacles). The purpose of this study is to collect baseline information on fish populations within Pinnacles and monitor changes over time to help evaluate the MPA's effectiveness. Located offshore at the north end of Carmel Bay, the site is characterized by high rocky relief areas, which form pinnacles separated by sand channels. While many of the newly adopted central coast MPAs have various levels of rocky habitat, few if any have as high a degree of variability as the Pinnacles site.
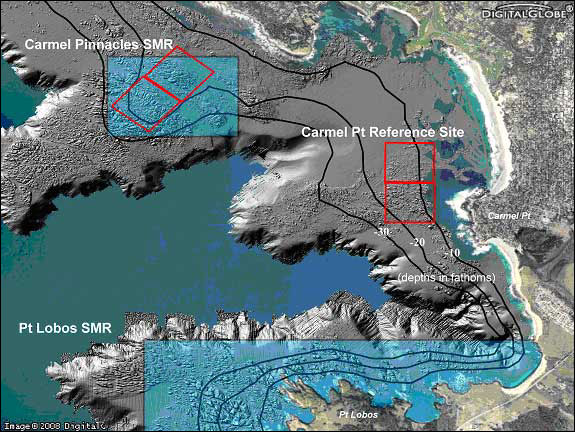 Sampling areas (red boxes) and bottom topography at Carmel Pinnacles State Marine Reserve and Carmel Point. Rough areas represent higher relief and rocky habitat.
Study Methods
From 2008 to 2010, data on nearshore groundfish abundances, sizes, catch rates, and movements inside this MPA and in a nearby reference site at Carmel Point were collected by California Department of Fish and Wildlife (CDFW) staff using mark and recapture (tagging) methods. Sampling was conducted during summer through early fall each year; typically July through September. Groundfish species of interest included lingcod, cabezon, kelp greenling and rockfish. Following capture, fish were measured, tagged and released.
Hook-and-line: Local sportfishing charter boats and a Monterey Bay National Marine Sanctuary research vessel were used to help catch and tag fish using rod and reel (hook-and-line) at Pinnacles and Carmel Point. Fishing occurred within two 500m x 500m grid cells at each site.
To engage the public as participants in the study, flyers were posted at boat ramps, tackle shops, and online to recruit experienced volunteer anglers to help catch fish. Three gear types were used equally to catch fish: shrimp flies, shrimp flies with bait, and bar jigs with a shrimp fly teaser. To reduce mortality, fishing was limited to depths less than 120 feet; similar depths were fished at both sites. Following capture, fish were measured, tagged, and released. Fish exhibiting excessive trauma or fish that were less than 20 cm total length were released without being tagged.
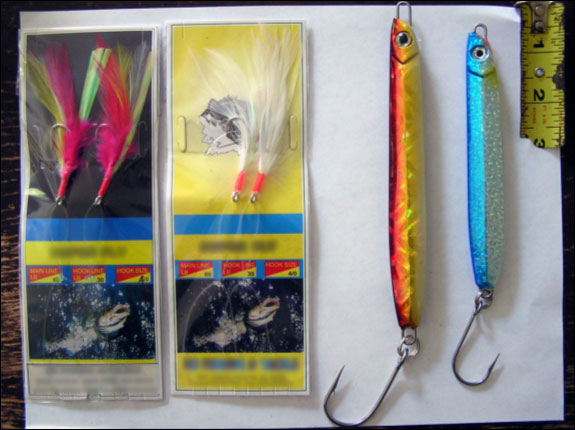 Shrimp fly and bar-jig gear used for hook-and-line sampling. CDFW photo by Scot Lucas.
Trap: Commercial trap gear was used to catch bottom associated species. Trapping occurred within the same grid cells as above, but during different weeks than the hook-and-line fishing. Two sets of between 10 and 12 traps were fished in each of the four grid cells each of three months, during summer and early fall. Squid was used as bait and traps were pulled after soaking for about one hour (see photo below). To reduce mortality and facilitate trap retrieval, trapping was limited to depths less than 75 feet; similar depths were fished at both sites. Following capture, fish were measured, tagged, and released.
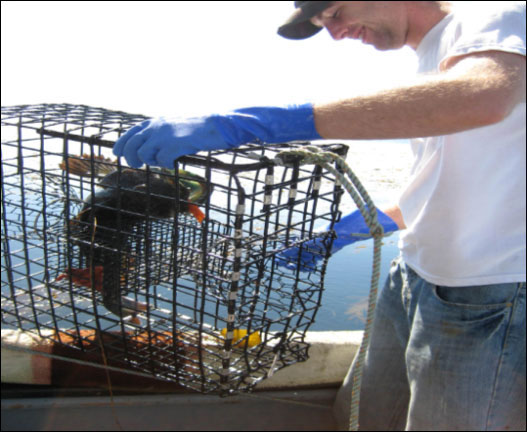 Commercial trap gear used to sample bottom associated species. CDFW photo by Diane Haas.
Findings to Date
Catch and species composition
Over three sampling years, a total of 87 volunteer anglers using hook-and-line gear caught 3,449 fish, 2,878 of which were tagged. The catch was comprised of 18 different species. Overall, more fish were caught outside the MPA than were caught inside, although fish were typically larger inside the MPA. Black, blue, canary, copper, olive, vermilion and yellowtail rockfish were caught more frequently at Carmel Point, while gopher, china and kelp rockfish were more common at Pinnacles. All other species were caught in similar numbers or were too few in number to report on. Blue, gopher and olive rockfish were the most common fishes caught both inside and outside of the MPA.
To complement hook-and-line sampling, a total 745 traps were deployed yielding 1,237 caught fish, 1,156 of which were tagged over the three years. Twelve species were represented in the catch. Gopher rockfish, china rockfish, and cabezon were the most common species trapped at Pinnacles, while gopher rockfish, black-and-yellow rockfish and kelp greenling were the most common fish trapped at Carmel Point. Gopher rockfish was overwhelmingly the dominant fish caught at both sites making up 74% and 80% of the catch at Carmel Point and Pinnacles respectively, over the three year period. More fish were trapped inside the MPA than outside the MPA, and fish inside the MPA were typically larger than those caught at the reference site.
Species composition of fish caught by site and gear type in 2008-2010
 Pinnacles Hook-and-Line.
 Pinnacles Trap.
 Carmel Hook-and-Line.
 Carmel Trap.
Fish abundance
Relative abundance of individual fish species at each site was calculated as catch per unit of effort (CPUE). CPUE is listed in the tables below as the average number of fish caught per "angler-hour" (number of anglers multiplied by number of hours fished) for hook-and-line fishing, and as the average number of fish caught per "trap-hour" (number of traps multiplied by number of hours soaked) for trap fishing. These baseline relative abundances will be important in looking at trends in catch rates over time.
CPUE for hook-and-line and trap gear
Note: Dashes (--) indicate no fish were caught for that species.
 2008.
2008.
 2009.
2009.
 2010.
2010.
 All Years.
 All Species Combined.
Fish lengths
Mean total lengths for 11 of the 14 most frequently caught species (gear types combined by site and year) were larger at Pinnacles than at Carmel Point in 2010. This is an increase in number of species from 2008, in which 8 of 14 common species were larger at Pinnacles than at Carmel Point. One species, canary rockfish, was common at Carmel Point but not caught at Pinnacles at all in the three years. Another species, black rockfish, was common at Carmel Point in 2008 but only one was caught at this site in 2010. Black rockfish were either rare (2008) or not encountered (2009, 2010) at Pinnacles over this period.
The smallest groundfish caught using hook-and-line were blue rockfish and yellowtail rockfish at 13 cm, and the largest was a 75 cm lingcod. For trap gear, the smallest groundfish caught was a 17 cm gopher rockfish and the largest was a 74 cm lingcod.
 Average Total Length of Common Fish Caught Using Hook-and-Line and Trap Gear combined at Carmel Pinnacles SMR (MPA) and Carmel Pt (REF) from 2008-2010.
Information about the amount of mature-sized fish in a community is an important indicator of the overall health and stability of a population. Preliminary data from this study indicate that both black and yellowtail rockfish average total lengths were much smaller than the recognized length at 50% maturity, regardless of site. To a lesser extent, blue, copper, olive and vermilion rockfish average lengths, as well as lingcod, were also under the recognized length at 50% maturity for these species at both sites. All other species had average total lengths above the recognized size at 50% maturity.
Tag recaptures
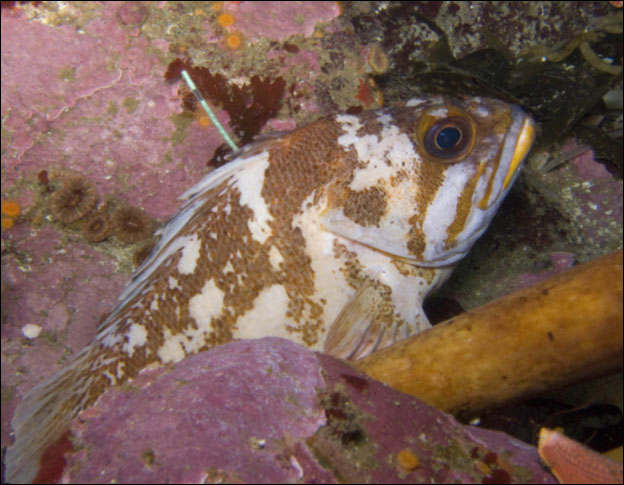
To date, 59 tagged fish have been recaptured and released during CDFW sampling days; 20 tagged fish have been recaptured by the public (recreational/commercial fishermen and recreational divers); and 24 tagged fish have been visually "recaptured" by CDFW staff during scuba surveys (see photos below). One cabezon has been recaptured twice. So far, all fish have been recaptured in the same general area where they were originally tagged.
 Tagged cabezon at Carmel Pinnacles State Marine Reserve, January 2009. Photo by Clinton Bauder.
 Tagged gopher rockfish at Carmel Pinnacles State Marine Reserve, January 2009. Photo by Jim Van Gogh.
What to do if you catch a tagged fish
Each tag has a unique ID number and a CDFW phone number for anglers to call when they catch a tagged fish. Anglers are asked to provide the following information when reporting a tagged fish:
- tag number
- date caught
- general location or GPS coordinates
- total length (estimated or measured)
- any additional information
Other Studies
Several non-CDFW studies are currently being conducted within the Carmel Bay area as well. One particular study by Rick Starr at Moss Landing Marine Laboratory also collects data on fishes using similar methods at Pt. Lobos State Marine Reserve (SMR). Closed to all fishing since 1973, data collected at Pt. Lobos SMR will provide a useful gauge with which to compare the nearby Pinnacles site as it is monitored over time.
More information can be found on the Sanctuary Integrated Monitoring Network website.
Nearshore Fishes at Carmel Bay
Updated June 30, 2011
Background
The sustainable management of marine fisheries requires basic information about the biology and harvest of fish species. This may include information on life history (e.g. age, growth, and reproduction), habitat requirements, and fishery trends. Collectively, this body of biological, ecological, and socioeconomic information is known as essential fishery information (EFI), which is used in the development of fishery management plans (FMPs).
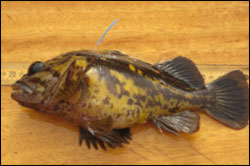
Under the Marine Life Management Act, the CDFW is required to create FMPs that will form the primary basis for managing California's marine fisheries. Kelp greenling (Hexagrammos decagrammus) and cabezon (Scorpaenichthys marmoratus) are two of the 19 finfish species in the CDFW's Nearshore Fishery Management Plan. Both species inhabit nearshore kelp beds and rocky reefs, and are highly sought after by both recreational and commercial fishermen. Recent reviews in California have listed these species, as well as several other nearshore species, as lacking EFI. Current knowledge on kelp greenling and cabezon population biology is limited, especially regarding abundance and mortality.
Study Methods
From 2008 to 2010, a trapping study was conducted to capture, tag, and recapture fishes to collect missing EFI for kelp greenling, cabezon, and other important nearshore fishes at two sites around Carmel Bay. These sites were located in both fished and protected areas. Information collected includes species composition, catch per unit of effort (CPUE), size, and movement of nearshore groundfishes. This study will augment data used by other projects and will be valuable for management and future stock assessments.
Fish trapping
Two sites were sampled: Lingcod Reef off of Pescadero Point and Point Lobos State Marine Reserve (SMR). Traps were deployed each year during summer months, typically July through September. Each site consisted of four 250 x 500 m grid cells.
At each site, grid cells were randomly selected to sample over a three day period. In each selected grid cell, three sets of 12-15 traps were deployed daily. One set was attempted in each of three depths per day: less than 30 ft., 31-60 ft., and 61-90 ft. Each trap was baited with chopped squid, deployed 10 to 20 meters apart, and soaked for about one hour. Captured fish were measured, weighed, tagged, and released.
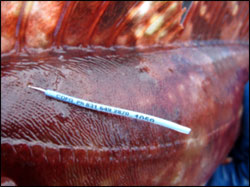 T-bar anchor tag in cabezon.
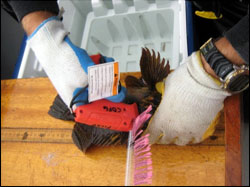 Tagging a black-and-yellow rockfish.
 Black-and-yellow rockfish recently recaptured after 267 days at liberty.
Findings to Date
Catch and effort
- 2,272 traps deployed over 60 days of sampling
- 1,673 fish from 16 species captured and tagged
- Average CPUE = 0.73 fish/trap hour
- Overall, CPUE was greater at Point Lobos (0.76 fish/trap hour) than at Lingcod Reef (0.70 fish/trap hour)
- The most abundant species caught were:
- Gopher rockfish (Sebastes carnatus)
- Black-and-yellow rockfish (Sebastes chrysomelas)
- Kelp greenling
- Cabezon
- A wide size-range of fish were caught:
- Smallest: 124 mm TL striped surfperch (Embiotoca lateralis)
- Largest: 1,150 mm TL wolf-eel (Anarrichthys ocellatus)
Effects of sites and depths
- CPUE varied by site, depth, and species
- Gopher rockfish had greater CPUE at Point Lobos SMR
- Cabezon had greater CPUE at Lingcod Reef
- Fish were larger at Point Lobos, particularly black-and-yellow and gopher rockfish
- More species were captured at Lingcod Reef than at Point Lobos SMR each year
- In all years combined, 16 species were found at Lingcod Reef while 11 species were found at Point Lobos SMR.
 Catch per unit effort (CPUE) for four of the most abundant species by site and year.
Recaptures
- To date, 46 fish have been recaptured (~3% recapture rate)
- Recapture species include black-and-yellow rockfish, gopher rockfish, cabezon, kelp greenling, and lingcod
- Fish made gross movements of 3 to 270 m from tagging site
- Fish were recaptured from 22 to 1,014 days after original capture
- Nine tagged fish have been re-sighted during scuba surveys
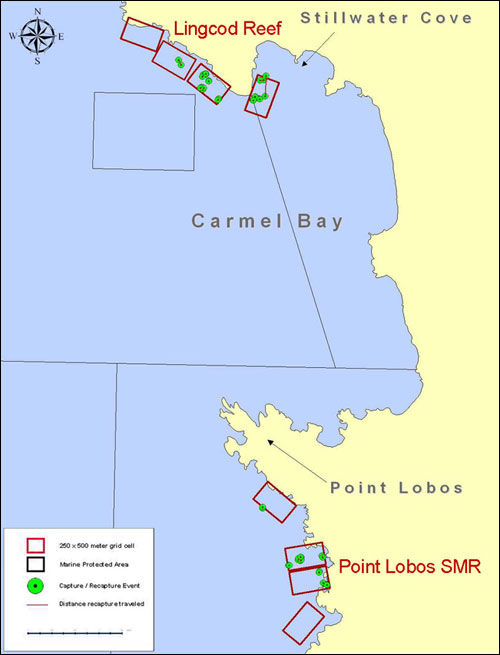 Map of Carmel Bay showing grid cells at Lingcod Reef and Point Lobos SMR sampling sites. Recaptured fish start and end points are shown in green.
Overall, trapping efforts were successful in collecting cabezon, greenling, and other nearshore species of interest. The species composition, CPUE and recapture rate of fishes collected during this study were comparable to those found in other nearshore trap studies. The information collected during this study will provide a basis of comparison for future studies.
What to do if you catch a tagged fish
Each tag has a unique ID number and a CDFW phone number for anglers to call when they catch a tagged fish. Anglers are asked to provide the following information when reporting a tagged fish:
- tag number
- date caught
- general location or GPS coordinates
- total length (estimated or measured)
- any additional information