This appendix provides an overview and considerations associated with a range of HCR approaches. As with the other appendices, it is anticipated this overview will continue to be expanded and refined as part of Master Plan implementation so it can serve as an effective resource to managers and stakeholders.
Harvest Control Rules
As discussed in Chapter 5, HCRs are simply rules for the management of a fishery. They are usually composed of an equation, formula, or procedure that links a change in one or more indicators with a corresponding change in fishing behavior. The HCR connects the current status of the stock (as determined via the data collection and assessment procedures) with the measures that will control fishing.
HCRs can be based on either a single indicator or multiple indicators. Those indicators can be model outcomes (an estimate produced by a stock assessment method, such as the current fishing mortality or biomass of the stock) or empirical metrics (measured directly from the fishery, such as the mean length of the catch or the CPUE). Regardless of whether the indicator is empirical or estimated, it provides information on the status of the stock. HCRs provide a pre-determined method for comparing that indicator against a target or limit reference point and adjusting fishing behavior as needed to avoid limits and reach the target.
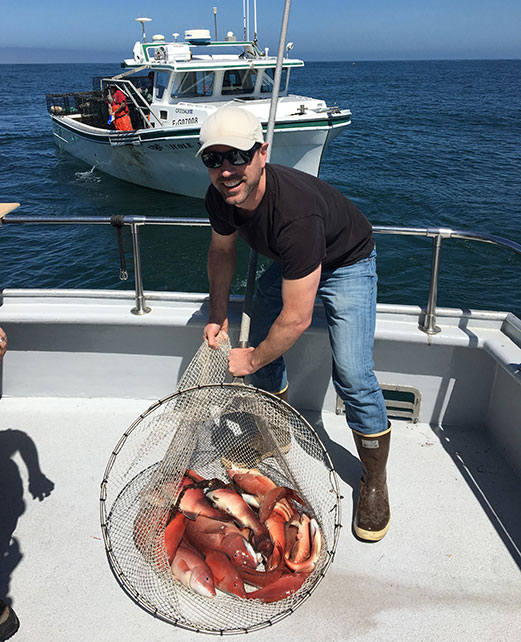 Net full of California sheephead collected from commercial fish traps. (Gary C. Graham photo)
Reference points
Reference points are metrics that combine several components of fishery performance into a single value. Reference points are commonly expressed as either a biomass level or fishing mortality rate that would achieve that biomass level under long-term equilibrium fishing conditions. Management actions may be required depending on where the indicator falls relative to the reference point. Commonly used reference points include the following:
- Fmax, the fishing mortality rate (F) that produces the maximum Yield Per Recruit (YPR).
- F0.1, the fishing mortality rate corresponding to 10% of the slope of the YPR curve at the origin.
- FX%SPR, the fishing mortality rate that would achieve X% of the spawning potential under no fishing.
- FMSY, the fishing mortality rate which maximizes the total catch.
- BMSY, (Population Biomass at Maximum Sustainable Yield) the biomass which produces the maximum catch.
Fishery managers also frequently use limit and target reference points. Limit reference points are the point beyond which fishing is no longer considered sustainable, and target reference points define the ideal fishery state. The use of these reference points is designed to constrain harvesting within safe biological limits. They are used in part because stocks fluctuate in response to natural ecological and environmental variability. Achieving a single point value is unlikely.
Some management strategies include a threshold reference point between target and limit reference points. The threshold reference point is defined as an early warning reference point, to reduce the probability that a limit point would be passed due to estimation or observation uncertainty or slow management reaction. Under these management approaches, limit points should never be reached, and if they were to be reached, severe and corrective management actions should be implemented. Thresholds are advisable when there is an especially high probability of a negative outcome when the limit is crossed (e.g., in a highly variable environment, when species are at the edge of their geographic range or are relatively susceptible to overfishing), or other circumstances when the cost of exceeding the limit is high.
Because reference points are often set using biological models, it can be difficult to determine reference points for data-poor stocks. In situations where there is insufficient knowledge to develop a model, proxies can be used. Proxies are substitutes for key biological reference points that are easier to calculate, require fewer data, or are more robust. For example, 40% of unfished biomass is considered a proxy for MSY for rockfish off the west coast, though the true MSY value is likely different depending on the specific biology of each species
In general, reference points from YPR and spawning-stock-biomass-per-recruit analyses are easier to calculate because they only require biological information. For this reason, YPR and spawning-stock-biomass-per-recruit reference points are often used as proxies for other reference points that require stock and recruitment data. However, it is also possible to set empirical reference points when biological or recruitment data are missing. Empirical reference points are functionally similar to model-based reference points in that they trigger management action when crossed, but they are not necessarily directly related to the biological productivity or resiliency of the stock. For many data-poor stocks, catch history, catch at length, or CPUE may provide empirical indicators that can be used to understand stock status relative to reference points and make management decisions. For these stocks, reference points might be set based on historical trends during a time period when the fishery was perceived to be stable. See Appendix I for more details. In extremely data-poor situations, target and limit reference points may be identified by expert judgment, but these should be paired with a monitoring program to decrease uncertainty in the future.
The MLMA requires that FMPs include criteria for determining when a fishery is overfished (§7086(a)). Limit reference points provide a simple and straightforward mechanism for defining this criterion. When a limit reference point is crossed, the MLMA requires that a recovery or rebuilding plan be implemented (§7086(c)). A recovery plan is usually built into a comprehensive HCR, which specifies the appropriate management action at all stock levels. The HCR should be tested to ensure that it complies with the MLMA requirements for overfished stocks, including the time requirements for rebuilding.
Harvest Control Rule frameworks
Data-rich Harvest Control Rules
The most common types of HCRs provide a link between the current estimated stock status and the desired catch, effort, or fishing mortality level for the fishery. This relationship can take many functional forms. Figure J1 shows a suite of different kinds of HCRs that link a generic stock status parameter with the TAC, Total Allowable Effort (TAE)(opens in new tab), or fishing mortality prescribed for each value of that stock status parameter. The types of HCRs illustrated demonstrate a tradeoff between simple but less responsive forms, such as the constant and threshold forms, and more responsive but more complex forms. These more complex forms are most commonly employed in data-rich fisheries, in which a quantitative stock assessment model is used to estimate biomass. They are usually designed and tested using MSE as described in Appendix L.
Data-poor Harvest Control Rules
While most data-poor fisheries lack the means of obtaining an estimate of biomass for use as a single metric of stock status, there is still a need to link the available information to control measures. This is often achieved by identifying empirical reference points, which specify that some kind of action must take place when the indicator passes a certain level. Under this type of framework, the indicator can be any type of data collected via the monitoring of the fishery (whether it undergoes analysis via a data-limited assessment technique or not), and the control measure can be any kind of mechanism for altering fishing behavior. For example, a simple HCR could specify that if the mean length of the catch (the indicator) drops below the average size of maturity (the trigger), a size limit will be instituted (the control measure).
Figure J1. Examples of six basic functional forms for harvest control rules (adapted from Berger et al. 2012).
| HCR
|
General Description and Implications
|
Graphic
|
| Constant
|
A constant control rule maintains a single target value for
the controlling measure, regardless of stock status.
|

|
| TAC/TAE: promote stability but
at the cost of either lower overall yields or higher levels of risk
associated with reaching undesirable population states.
|
| TAF: harvest remains
proportional to stock status.
|
| Threshold
|
A threshold rule also maintains a single target value for the
controlling measure up until a limit is reached, at which point fishing
ceases.
|

|
| TAC/TAE: promote stability at
healthy population sizes.
|
| Reduces risk of fishery
collapse.
|
| Potential for fishing
closures.
|
| Step
|
A step rule incorporates discrete (or step-wise) increments in
the control measure such that higher levels are permitted with improved stock
status.
|

|
| Control measure adjusts with
stock status.
|
| Increased variation in
yield.
|
| Abrupt changes in the value of
the control measure.
|
| Sliding (Simple
linear)
|
A sliding (or "state-dependent" or "adjustable
rate") rule allows for a continuous adjustment in the control measure.
Higher levels are permitted with improved stock status.
|

|
| Moderate yields but generally
with low levels of risk.
|
| Increased variation in
yield.
|
| Gradual change in the value of
the control measure.
|
| Sliding (Complex
linear)
|
Same as above but linear combinations can be complex.
|

|
| Incorporate multiple
transition points (e.g., according to limit, trigger, target, etc. management
reference points).
|
| Contention from uncertainty in
stock status when near transition points.
|
| Sliding
(Non-linear)
|
Same as two above except continuous adjustment is
non-linear.
|

|
| Smooth function.
|
| No major transition points so
uncertainty in stock status tends to be less contentious.
|
There are many different kinds of indicators, triggers, and control measure combinations. For each fishery, the appropriate combination will depend on what types of data and biological information are available on a regular basis given the resource constraints of the managing agencies, the objectives of management, and which control measures are appropriate for the fishery. There are many different ways to specify how the control measure should be adjusted. Table J1 provides examples for how various controls can be adjusted in response to changes in indicators.
Table J1. Examples of the types of harvest control rules that can be implemented for each kind of management control response (adapted from Dowling et al. 2016).
| Harvest Control Rule families
|
| Catch or effort limits
|
Adjust by fixed proportions up and
down
Adjust in proportion to distance from a reference
point or proxy
Adjust according to assessment
outcomes
Adjust from monitoring-closed areas or
MPAs
|
| Gear
|
Adjust gear selectivity to achieve
targets
Adjust to counteract effort
creep
Adjust to avoid capture of
undesired/overfished/at-risk species
Restrict
location and or season in which certain gears can be employed to avoid
bycatch or habitat impacts
|
| Spatial restrictions
|
Open or close areas in response to
stock triggers
Rotate after catch is achieved in a
specific area
|
| Size limits
|
May be invoked or modified to
adjust selectivity in response to targets
May be
indirectly achieved via temporal, spatial, or gear restrictions
|
| Sex restrictions
|
May be invoked in response to
targets or triggers
|
| Temporal restrictions
|
Adjust time of day when fishing is
allowed in response to trigger
Adjust season duration in
response to trigger
Start and stop fishing in response to
trigger
Implement seasonal closure
|
| Other management responses
|
Trigger data collection (for
example, when a catch or participation trigger is
passed)
Application of additional
precaution/buffers
Overrides in cases of exceptional
circumstances
Retain status quo (apply a
wait-and-see approach)
Taxes, fees, or other financial
incentives to alter fishing behavior
|
These trigger systems are useful because they are readily understood by stakeholders. For this reason, they provide an opportunity for involving stakeholders in management by helping to identify triggers and consequent actions. They are inherently adaptive as the trigger level values can be revised as understanding improves. The HCR can also trigger increased monitoring to provide management agencies with a way to keep management costs low while the fishery stays in the healthy zone and increase management activities when the fishery moves into the precautionary zone.
Multi-indicator Harvest Control Rules
HCRs are increasingly being designed to respond to multiple indicators instead of a single indicator. HCRs that are based on multiple indicators perform better because they track different aspects of the population. Sometimes there can be unidentified biases in indicators, and using multiple indicators provides a safeguard against being overly reactive, or not reactive enough. Additionally, attempting to control one aspect of fishing (e.g., instituting a size or catch limit) can have unintended consequences such as an increase in regulatory discards, which may result in increased mortality. For this reason, there is usually a need to monitor the population health on multiple fronts, and to institute or alter a number of different control measures in order to achieve management objectives.
“Traffic light” HCR frameworks are an example of a trigger system with multiple indicators. Indicators that pass their limit reference points function as “red lights”, signaling to stop fishing. Those between their target and limit reference points function as “yellow lights”, signaling to “proceed with caution”, and indicators that are within a reasonable range of their target reference points are “green lights”, signaling that the fishery is in a healthy zone. One issue that can arise with the traffic light approach is how to respond to mixed signals that occur when different indicators achieve different colors (Punt et al. 2001; Basson and Dowling 2008). These scenarios must be carefully thought through during the design phase to ensure that the management response is appropriate.
Hierarchical decision tree frameworks allow for a decision to be reached by a sequential series of intermediate decisions. The most important decision criteria are in the upper part of the tree and applied first, which is a useful filtering system. The questions lower down on the tree refine the management approach. Decision trees allow for more complex management than traffic light systems, but each decision point on the tree is relatively easy for stakeholders to understand so transparency can be maintained. Because of this, decision tree HCRs are a powerful tool that allow for a series of simple HCRs to be combined to form a relatively sophisticated management tool.
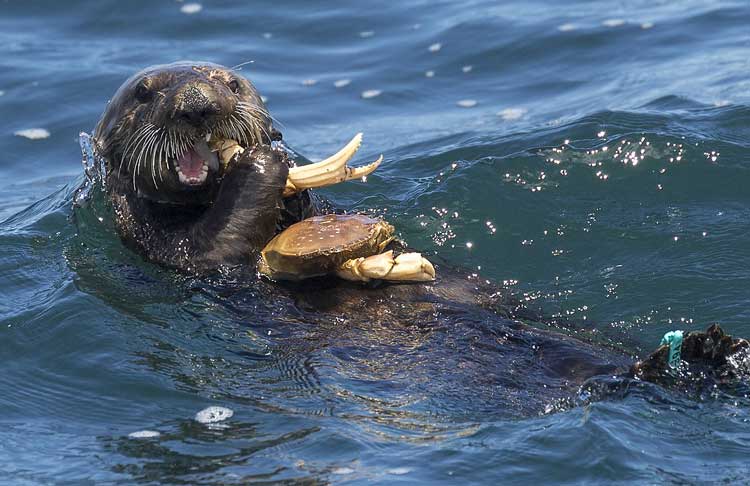 Sea otter eating a crab in Monterey Bay. Ecosystem-based Fishery Management (EBFM) recognizes the full array of interactions within an ecosystem, such as predator-prey interactions. (Chase Dekker/Shutterstock photo)
Ecosystem-based indicators in Harvest Control Rules
There is a broad understanding of the connection between ecosystem health and sustainable fisheries, which has spurred calls for the implementation of EBFM to try and mitigate fishing impacts at the ecosystem level (Pikitch et al. 2004). In designing HCRs to make management decisions for target stocks, managers are embracing several of the central tenets of EBFM (Long et al. 2015), including:
- Long term sustainability;
- Adaptive management;
- Precautionary management;
- Acknowledgement of uncertainty;
- Use of scientific knowledge;
- Appropriate monitoring; and
- Management decisions that reflect societal choice.
However, the complexities and scale of holistic ecosystem management have made it difficult to operationalize EBFM in a practical way, especially for data-poor fisheries. Including ecosystem indicators in HCRs facilitates implementation of some core principles of EBFM (Long et al. 2015), including:
- Consideration of ecosystem connections;
- Accounting for the dynamic nature of ecosystems; and
- Preserving ecological integrity and biodiversity(opens in new tab).
By including ecosystem indicators such as sea surface temperature in HCR frameworks, managers are able to explicitly acknowledge links between the decisions made for a target stock and the impacts on the wider ecosystem. Many HCRs have bycatch indicators, in which fishing activities are altered or curtailed based on the catch of indicator bycatch species as a means of limiting the ecosystem impacts of fishing. Bycatch, especially of threatened or ecologically important species, has direct impacts on biodiversity and ecosystem integrity, and this is one way to attempt to mitigate those impacts.
Fishing has indirect impacts on species that are not bycatch but are trophically related to the target species as predators or prey. Care must be taken to ensure that the HCR is not overly-reactive to predator fluctuations since few predators are solely dependent on a single prey item, and the health of predators is likely dependent on a wide range of factors in addition to food availability. In these situations, the HCR might require managers to assess the population of the predator in question during each decision-making cycle, but only trigger a change in fishing activities when very specific conditions are met. For management of a forage fish, it may be possible to include an indicator of alternative forage to assess whether the needs of the ecosystem’s predators are being met. A quantitative alternative forage indicator is currently being developed as part of the NOAA’s Integrated Ecosystem Assessment program for the CCE(opens in new tab).
Including ecological and environmental indicators in HCR frameworks also provides a way to acknowledge and incorporate ecosystem dynamics, which are constantly fluctuating, into decision-making processes. Many fish species, especially those at lower trophic levels, are highly responsive to environmental changes that affect the productivity of the system as a whole. Examples of these types of indicators include temperature, salinity, or plankton levels. For example, the Pink Shrimp fishery uses a combination of ecosystem indicators (e.g., April sea surface height) and fishery dependent indicators (e.g., CPUE and number of age-0 shrimp in the catch) to determine the start and end dates of the season (Hannah 1993). The Pacific Sardine fishery is managed using an HCR that includes a temperature indicator to determine the harvest rate (Hurtado-Ferro and Punt 2014).
It is important to establish a link to look for correlations between indicators and metrics of population health. This is usually done via a regression analysis and requires time series of data, which may not be possible for data-poor fisheries. Additionally, when looking for correlations between indicators and response variables it is important to consider alternative temporal lags and spatial scales since correlations might go undetected at the yearly timescale at which we normally consider stock management. Establishing links between the environmental or ecological indicators and the productivity of the stock may allow mangers to recognize changing conditions, such as the those due to regime shifts or climate change, and proactively manage for these situations.
The science on using ecosystem indicators in HCRs to make harvest decisions for target stocks is emerging and should be applied cautiously. HCRs are usually crafted so that the indicator and management control are causally linked. This helps ensure that managers can see results in the indicator of interest when they alter fishing behavior, which is an important component of the adaptive management process. However, because the links between ecological indicators and target stocks are rarely understood, implementing these types of indicators in an HCR framework may be difficult, and managers should proceed with caution.
References
Basson, M., and N. A. Dowling. 2008. Development of a robust suite of stock status indicators for the Southern and Western and the Eastern Tuna and Billfish fisheries. Canberra, Australia: Fisheries Research and Development Corporation Project No. 2003/042. 348 pp.
Berger, A.M., S.J. Harley, G.M. Pilling, N. Davies, and J. Hampton. 2012. Introduction to Harvest Control Rules for West-Central Pacific Ocean (WCPO) Tuna Fisheries.
Dowling, N. A., J. R. Wilson, M. B. Rudd, E. A. Babcock, M. Caillaux, J. Cope, D. Dougherty, R. Fujita, T. Gedamke, M. Gleason, N. Gutierrez, A. Hordyk, G. W. Maina, P. J. Mous, D. Ovando, A. M. Parma, J. Prince, C. Revenga, J. Rude, C. Szuwalski, S. Valencia, and S. Victor. 2016. FishPath: A Decision Support System for Assessing and Managing Data- and Capacity-Limited Fisheries. 37 pp.
Long, R. D., A. Charles, and R. L. Stephenson. 2015. Key principles of marine ecosystem-based management. Marine Policy 57:53-60.
Hannah, R. W. 1993. Influence of environmental variation and spawning stock levels on recruitment of ocean shrimp (Pandalus jordani). Canadian Journal of Fisheries and Aquatic Sciences 50(3):612-622.
Hurtado-Ferro, F., and A. E. Punt. 2014. Revised Analyses Related to Pacific Sardine Harvest Parameters. Pacific Fishery Management Council, Portland, Oregon. 31(15): 97220.
Pikitch, E., C. Santora, E. A. Babcock, A. Bakun, R. Bonfil, D. O. Conover, P. A. O. Dayton, P. Doukakis, D. Fluharty, B. Heneman, and E. D. Houde. 2004. Ecosystem-based fishery management. Science 305(5682):346-347.
Punt, A. E., R. A. Campbell, and A. D. M. Smith. 2001. Evaluating empirical indicators and reference points for fisheries management: Application to the broadbill swordfish fishery of eastern Australia. Marine and Freshwater Research 52:819-832.
Photo at top of page: Fishing boat along the California coast. (HTurner/Shutterstock photo)