Project Overview
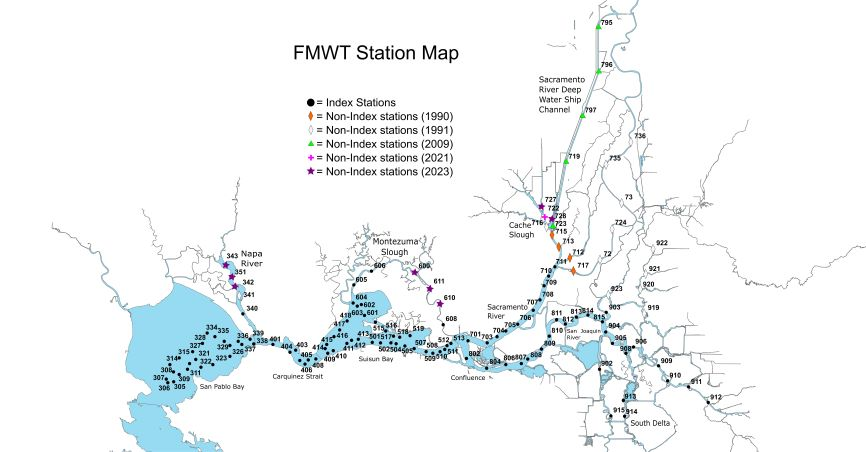
The Fall Midwater Trawl Survey (FMWT) has sampled annually since it's inception in 1967, with the exceptions of 1974 and 1979, when sampling was not conducted. The FMWT was initiated to determine the relative abundance and distribution of age-0 striped bass (Morone saxatilis) in the estuary, but the data has also been used for other upper estuary pelagic species, including delta smelt (Hypomesus transpacificus), longfin smelt (Spirinchus thaleichthys), American shad (Alosa sapidissima), splittail (Pogonichthys macrolepidotus), and threadfin shad (Dorosoma petenense). The FMWT samples 122 stations each month from September to December and a subset of these data is used to calculate an annual abundance index. These 122 stations range from San Pablo Bay upstream to Stockton on the San Joaquin River, Hood on the Sacramento River, and the Sacramento Deep Water Ship Channel. Sampling takes approximately 9 days per month to complete. Historically, FMWT sampling occasionally began as early as July (1972) or August (1968-1973, 1993-1994, 1996-1997) and sometimes continued past December to March (1968-1973, 1978, 1991-2001) or beyond (1992-1995). The consistent January-March midwater trawl sampling conducted from 1991-2001 to track movements of mature adult delta smelt was replaced in 2002 with the more effective Spring Kodiak Trawl.
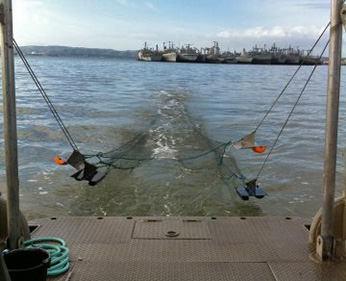
The midwater trawl net has mouth dimensions of 12 ft x 12 ft when stretched taught, but mouth dimensions will be smaller when under tension during a tow. Net mesh sizes graduate in nine sections from 8-inch stretch-mesh at the mouth to 0.5-inch stretch-mesh at the cod-end. All four corners of the net mouth are connected to planing doors, which together counteract the drag on net material and hold the net mouth open when being towed through the water. At each station a 12 minute tow is conducted during which the net is retrieved obliquely through the water column from bottom to surface. All fish, shrimp, and jellyfish are identified and enumerated. In addition, the crew measures water temperature, electrical conductivity (specific conductance), Secchi depth, and turbidity.
FMWT equipment and methods have remained consistent since the survey's inception, which allows annual abundance indices to be compared across time. Monthly and annual abundance indices are calculated using catch data from 100 “index” stations grouped into 14 regional “areas”. Monthly indices are calculated by averaging catch per tow for index stations in each regional area, multiplying these means by their respective weighting factors (i.e., a scalar based on water volume) for each area and summing these products for all 14 areas. Annual abundance indices are the sum of the 4 (September-December) monthly indices.
The FMWT was mandated by the Delta Smelt Biological Opinion for the coordinated operation of the Central Valley Project and the State Water Project.
Stations Map